Image of giant corn in city

To sustain a hungry world...

CME Group gives the agricultural industry the tools to help it put food on the table.

Image of fuel pipeline

To deliver in a changing energy landscape...

CME Group gives the energy industry the tools to help it keep resources flowing.

Image of financial path

To make the most of market opportunity...

CME Group gives the financial industry the tools to help it address market exposure.

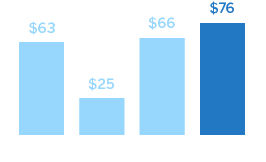
Investment professionals need ways to offer their clients — be they individuals or institutions — the right balance between risk and reward. CME Group helps them manage risk and capitalize on opportunities across major markets worldwide, where the total value of equity investments has reached more than $70 trillion. That’s an increase in value of more than 160% since the 2009 low of $27 trillion.

Source: The Street, Seeking Alpha

Total value of stocks
worldwide (trillions)

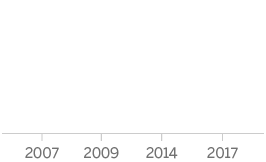
Total value of stocks worldwide was 66 trillion as of 2014
Values of stocks worldwide in 2007, 2009 and 2014
Source: The Street

In terms of Purchasing Power Parity, the size of the world economy in 2040 is expected to be 260% of that in 2013.

Image of money origami illustrating 260% increase in purchasing power by 2040
Source: OPEC
Chart icon Chart icon

Investor confidence in the U.S. has rebounded strongly, if slowly, since 2009, fueling a nearly unprecedented period of sustained growth.

Based on a comparison of index values on 2/23/09 and 1/17/18 the average growth has risen to 359%.

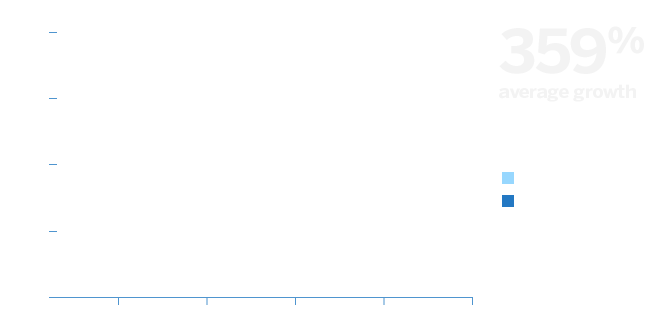
Line graph showing growth between 2010 and 2015 Line graph showing growth of 177% as of 2015 Line graph showing growth between 2010 and 2015
Source: S&P Dow Jones Indices

12.2%

On average, the market value of the wealthiest 25 colleges increased by 12.2% in 2017.

Source: Time Inc.

Concurrently, presumed growth in both the global middle class and global equity markets is creating new investment opportunities all the time. Be it an employee planning for retirement or a university managing its endowment, long-term security is key for individuals, businesses, institutions and governments whose progress relies on returns.

Population growth in the global
middle class (billions)

Chart showing global middle class reaching 4.9 billion by 2030
Chart showing middle class population growth between 2009 and 2030
Source: OECD.org

The role of derivatives in managing risk

A forward-thinking mindset is key to investing in today’s unpredictable economic environment. At CME Group, we give investment professionals and portfolio managers the products they need to effectively manage inherent price risks and plan the future of their funds — helping those they serve benefit from these vital markets.

Globe icon Globe icon

Upward mobility is up worldwide. Nowhere is that more apparent than in a rapidly growing Asian middle class.

Asia will represent 66% of the global middle-class population and 59% of middle-class consumption by 2030, up from 28% and 23%, respectively, in 2009.

Meanwhile, European and American middle classes will shrink from 50% of the global total to just 22%.

Pie chart key for Asia in 2009 and 2030
Pie chart showing Asia representing 28% of global middle class in 2009 Pie chart showing Asia representing 66% of global middle class by 2030
Pie chart key for Europe and America in 2009 and 2030
Pie chart showing Europe and America representing 50% of global middle class in 2009 Pie chart showing Europe and America representing 22% of global middle class by 2030
Source: OECD.org & Reuters

See more of how the world advances

Food

Helping global agribusiness meet the needs of a fast-growing population

View

Image of giant corn in city
Image of fuel pipeline

Fuel

Enabling the energy industry to deliver in the face of ever-changing consumer demand

View