- 11 Jan 2021
- By CME Group

Source: CME Group, as of Jan 5, 2021.
Discover how our comprehensive suite of FX tools provides greater transparency across listed and OTC markets to see where opportunities lie. All tools are freely available on CMEGroup.com.
For the first time, we have brought CME Group’s distinct trading modalities of listed and spot FX, together in one new tool, so that FX traders around the world can compare and analyze the complementary liquidity available in these markets. Below is a use case demonstrating how a trader could use the tool:
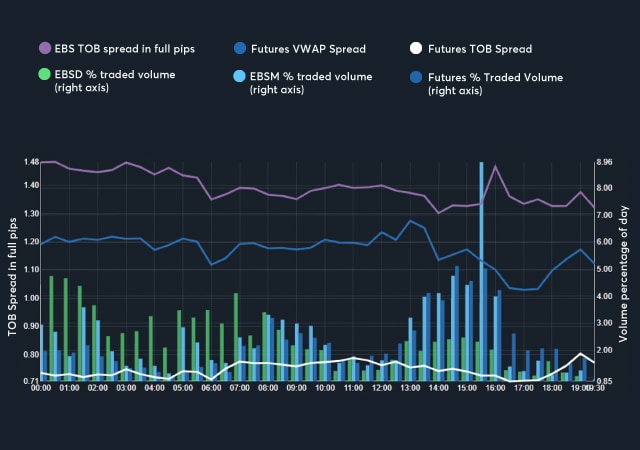
The minimum price increment for CME’s Australian Dollar futures contract was reduced from one pip to 0.5 pips, effective starting November 23, 2020. Shortly afterwards, we used the new FX Market Profile tool to provide a snapshot analysis of the impact of this change. In the first days after the change, the average top-of-book bid-ask spread was 0.3 pips tighter. With more data, we can take another look at the impact on the futures market.
The chart of top-of-book spread and traded volume for December shows that the average bid-ask spread for AUD/USD futures – the white line in the chart – is averaging 0.75 pips.
Source: CME FX Market Profile
The FXMP tool allows you to adjust the time period under review. Looking at the weekly development of the AUD/USD futures shows that the top-of-book bid-ask spread fell from an average of 1.15 pips prior to the MPI change, to 0.86 the following week, and has continued to tighten over time to an average of 0.68 pips in the week after Christmas – i.e. nearly 0.5 pips tighter than prior to the change.
Despite top-of-book order volumes declining in line with the tighter MPI, the VWAP spread – which indicates the overall futures bid-ask spread cost at the size available in the EBS cash market – has tightened by 0.3 pips over the period.
The FXMP tool also provides data on the distribution of the bid-ask spread. This shows that the median spread is now consistently 0.5 pips, with the market now rarely being wider than one pip. This demonstrates the depth of liquidity in the AUD/USD futures market and the substantial cost reduction made available by the MPI change.
The CME FX Swap Rate Monitor calculates the implied interest rate differential for eight currency pairs using tradable pricing data from CME FX futures and the FX Link central limit order book.
The above chart shows the implied rate differentials (IRD) for GBP/USD from December 21-31, 2020, across the year-end turn. The IRD was highest on December 22 at 0.51% following the discovery and announcement of a new strain of COVID-19 in the UK and the news that Congress passed a COVID-19 relief bill in the US, putting pressure on the GBP and boosting the USD.
The IRD narrowed towards the end of the year as UK Prime Minister Boris Johnson and EU leaders agreed to a post-Brexit trade agreement, which saw the GBP close the year on the front foot.
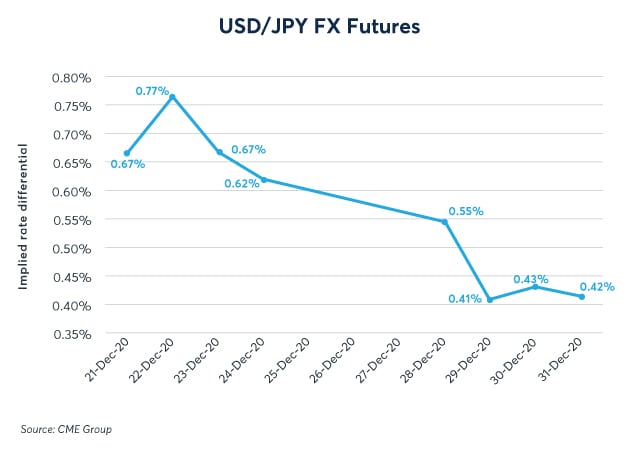
Above, we see the implied rate differentials (IRD) for USD/JPY from December 21-31, 2020, across the end of the year. Similarly to the GBP, the IRD was highest on December 22 at 0.77%, after Congress passed a COVID-19 relief bill in the US, boosting demand for dollars.
Following the Christmas weekend, the IRD narrowed to 0.42% which was led by pressure on the USD after speculation that the global economic recovery, now on the horizon due to COVID-19 vaccines, will pull money into riskier assets. Historically, both the USD and the JPY have been classed as the safe havens of the FX world, albeit for different reasons. However, the USD has fallen more than the JPY in 2020, which suggests a short-USD bias that continued to hold into the final month of 2020.
Our EMFX futures continue to expand, with increasing volume and new participants joining our market. Enhance your trading strategies by leveraging the growing liquidity in EM futures.
Average daily volume*- BRL: 10,408 | RUB: 5,588 | ZAR: 3,687
Average daily volume growth** – BRL: 20.4% | RUB: 33.4% | ZAR: 31.4%
*Number of contracts YTD 2020
**Number of contracts YoY: 2019 vs. 2020
The Vol Converter tool converts thousands of streaming prices in CME’s listed FX options into a short-format OTC-equivalent volatility surface, allowing participants to conveniently monitor option pricing across multiple G5 FX pairs in real time*.
The vol surface can be displayed in multiple views, including bid or offer side, mid-market, or using daily settlements. Users can drill-down on a specific volatility price to display the nearest contributing listed contracts and pricing data that can be traded on CME.
This unprecedented level of transparency, powered by firm trading prices from the world’s largest all-to-all electronic options platform, enables participants to truly compare OTC and listed pricing and to optimize execution across both markets. This becomes particularly relevant for firms looking for a capital efficient solution ahead of the upcoming 2021 and 2022 phases of the Uncleared Margin Rules.
The tool has been well received, with over 4000 individuals and 650 firms viewing the tool since its October launch.
Source: CME FX Options Vol Converter
*website tool delayed 15 min/real-time available via CME Direct
The final phases of the Uncleared Margin Rules will take effect over the next couple of years with the 2021 AANA calculation period starting this March that will capture participants above the $50 billion threshold (before dropping to the $8 billion threshold in 2022). With FX options exposure as one of the driving forces for initial and variation margin impact, CME’s listed options provide a capital efficient solution to the new rules.
We have made significant product enhancements to our Emerging Market (EM) options contracts to increase flexibility, align the contracts with OTC conventions, and deliver improved liquidity ‒ so you can manage risk more effectively across a broader solution of major currency and EM options.
Find out more on the growth of FX EM options trading
MXN options ADV was up 57% and OI up 34% in 2020, while the RUB and ZAR products were recently relaunched with full screen liquidity available during peak periods.
Source: CME Direct
Traders can access competitive liquidity through dedicated market maker streaming prices on Globex or through one of our many liquidity providers for a privately negotiated block price.
CME’s FX options products are seeing an increasing number of larger trades as participants are finding that trading in blocks and the actionable depth of electronic liquidity combine to provide more effective risk transfer on larger-sized execution. Volume from large trades, as a proportion of total FX options volume, has increased to nearly 30% in the past few months.*
*Volumes through Dec 14. See program details for definition of large trades. For example, minimum size in EUR/USD is 250 contracts or ~€31 million.
Each quarter, we publish The FX Report, which assembles all of the key news, views, and stats the broking community needs to know.


