- 19 Jul 2023
- By CME Group
- Topics: Equity Index
Equity Products Performance
|
Product Code |
Bloomberg Ticker |
May ADV |
YTD ADV* |
Open Interest |
|---|---|---|---|---|---|
Total |
6,903,546 |
6,763,304 |
10,114,691 |
||
S&P 500 |
|
|
4,291,529 |
4,351,500 |
7,974,759 |
Futures |
|
|
3,040,812 |
3,015,766 |
3,030,402 |
E-mini |
ES |
ESA Index |
2,020,793 |
1,847,559 |
2,217,777 |
Micro E-mini |
MES |
HWA Index |
943,442 |
1,110,136 |
162,238 |
BTIC |
EST |
STEA Index |
61,298 |
47,391 |
- |
BTIC+ |
ES1, ES2 |
ES1BTIC yyyymmdd Index |
- |
- |
- |
Dividend Future |
SDA, SDI |
ASDA, ISDA Index |
3,657 |
4,302 |
234,463 |
Total Return Futures |
TRI, CTR |
SRTA, CTIA Index |
9,400 |
4,942 |
399,463 |
TACO |
ESQ |
TQA Index |
76 |
249 |
- |
TACO+ |
EQ1 |
EQ1TACO yyyymmdd Index |
|
- |
- |
E-mini ESG |
ESG |
SLBA Index |
2,146 |
1,187 |
16,461 |
Options |
|
|
1,250,717 |
1,335,734 |
4,944,357 |
E-mini |
|
|
1,236,274 |
1,318,388 |
4,896,470 |
End-Of-Month |
EW |
SCA Index |
176,176 |
135,650 |
535,518 |
Quarterlies |
ES |
ESA Index |
151,186 |
131,902 |
1,182,264 |
Monday Weekly |
E1A-E5A |
IWWA Index |
127,446 | 129,844 |
394,800 |
Tuesday Weekly |
E1B-E5B |
IMBA Index |
120,328 |
118,511 |
58,069 |
Wednesday Weekly |
E1C-E5C |
IEWA Index |
146,481 |
143,566 |
344,830 |
Thursday Weekly |
E1D-E5D |
IMDA Index |
133,700 |
137,310 |
98,438 |
Weekly |
EW1 - EW4 |
1EA-4EA Index |
380,957 |
521,604 |
2,282,551 |
Micro E-mini |
|
|
14,442 |
17,346 |
47,887 |
NASDAQ |
|
|
1,784,703 |
1,795,161 |
581,806 |
Futures |
|
|
1,718,470 |
1,725,894 |
352,189 |
E-mini |
NQ |
NQA Index |
694,842 |
666,538 |
249,607 |
Micro E-mini |
MNQ |
HWB Index |
1,017,094 |
1,053,854 |
102,582 |
BTIC |
NQT |
QNTA Index |
6,534 |
5,502 |
- |
Options |
|
|
66,233 |
69,268 |
229,617 |
E-mini |
|
|
62,417 |
65,385 |
217,615 |
End-Of-Month |
QNE |
QNAA Index |
9,063 |
5,822 |
17,172 |
Quarterlies |
NQ |
NQA Index |
11,695 |
9,574 |
100,553 |
Monday Weekly |
Q1A-Q5A |
QNBA Index |
7,516 |
5,353 |
10,795 |
Tuesday Weekly |
Q1B-Q5B |
QETA Index |
9,459 |
4,981 |
3,031 |
Wednesday Weekly |
Q1C-Q5C |
QNCA Index |
10,111 |
6,771 |
7,431 |
Thursday Weekly |
Q1D-Q5D |
QHTA Index |
9,544 |
5,549 |
1,397 |
Weekly |
QN1 - QN4 |
1OA-4A Index |
5,029 |
27,335 |
81,664 |
Micro E-mini |
|
|
3816 |
3,883 |
12,002 |
DOW JONES |
|
|
260,112 |
302,849 |
114,134 |
Futures |
|
|
260,107 |
302,803 |
114,056 |
E-mini |
YM |
DMA Index |
176,452 |
177,862 |
94,731 |
Micro E-mini |
MYM |
HWI Index |
82,263 |
123,472 |
102,582 |
BTIC |
YMT |
YMTA Index |
1,392 |
1,468 |
- |
Options |
|
|
5 |
47 |
78 |
E-mini |
|
|
5 |
47 |
78 |
Russell 2000 |
|
|
379,423 |
322,471 |
556,463 |
Futures |
|
|
373,355 |
314,189 |
537,343 |
E-mini |
RTY |
RTYA Index |
281,940 |
226,221 |
519,687 |
Micro E-mini |
M2K |
HWR Index |
84,943 |
83,404 |
17,656 |
BTIC |
RLT |
RLBA Index |
6,472 |
4,564 |
- |
Options |
|
|
6,067 |
8,282 |
25,948 |
E-mini |
|
|
6,067 |
8,282 |
25,948 |
S&P 400 - MIDCAP |
|
|
16,824 |
13,980 |
37,982 |
Futures |
|
|
16,824 |
13,980 |
37,982 |
E-mini |
ME |
FAA Index |
16,824 |
13,980 |
37,982 |
INTERNATIONAL |
|
|
57,102 |
9,594 |
70,200 |
Futures |
|
|
57,102 |
9,594 |
70,200 |
Nikkei 225 |
ENY, N1, NK |
YMEA, NXA, NHA Index |
57,087 |
9,590 |
70,160 |
Ibovespa |
IBV |
IBAA Index |
2 |
1 |
17 |
TOPIX |
TPY |
TPYA Index |
13 |
3 |
23 |
SECTORS |
|
|
31,850 |
3,239 |
218,461 |
Futures |
|
|
31,850 |
3,239 |
218,461 |
Comm. Srvcs. |
XAZ |
XASA Index |
626 |
38 |
4,268 |
Cons. Discr. |
XAY |
IXYA Index |
1,164 |
89 |
8,530 |
Cons. Staples |
XAP |
IXRA Index |
2,425 |
424 |
15,768 |
Energy |
XAE |
IXPA Index |
4,547 |
365 |
23,149 |
Financial |
XAF |
IXAA Index |
4,106 |
299 |
33,704 |
Health Care |
XAV |
IXCA Index |
1,931 |
191 |
13,725 |
Industrial |
XAI |
IXIA Index |
1,965 |
233 |
15,062 |
Materials |
XAB |
IXDA Index |
2,735 |
111 |
17,919 |
Real Estate |
XAR |
XARA Index |
928 |
176 |
6,972 |
Technology |
XAK |
IXTA Index |
1,465 |
169 |
10,134 |
Utilities |
XAU |
IXSA Index |
3,869 |
445 |
26,003 |
Dow Jones Real Estate |
JR |
DJEA Index |
6,086 |
694 |
43,200 |
Nasdaq Biotech |
BQ |
DBA Index |
3 |
5 |
27 |
FTSE |
|
|
- |
0 |
- |
Futures |
|
|
- |
0 |
- |
FTSE China 50 |
FT5 |
FCYA Index |
- |
0 |
- |
Russell 1000 |
|
|
3,811 |
280 |
26,162 |
Futures |
|
|
3,811 |
280 |
26,162 |
Russell 1000 |
RS1 |
RSYA Index |
1,002 |
115 |
8,191 |
Russell 1000 Growth |
RSG |
RGYA Index |
530 |
41 |
4,367 |
Russell 1000 Value |
RSV |
RVYA Index |
2,279 |
124 |
13,604 |
Cryptocurrency |
|
|
38,597 |
38,768 |
105,696 |
Futures |
|
|
36,866 |
36,692 |
56,480 |
Bitcoin |
BTC |
BTCA Curncy |
12,587 |
10,899 |
18,264 |
Micro Bitcoin |
MBT |
BMRA Curncy |
11,694 |
10,611 |
12,893 |
Ether |
ETH |
DCRA Curncy |
4,628 |
5,301 |
4,960 |
Micro Ether |
MET |
MERA Curncy |
7,957 |
9,882 |
20,363 |
Options |
|
|
1,731 |
2,075 |
49,216 |
Bitcoin |
BTC |
BTCA Curncy |
206 |
450 |
10,387 |
Micro Bitcoin |
WM |
BMRA Curncy |
626 |
574 |
9,525 |
Ether |
ETH |
DCRA Curncy |
67 |
70 |
2,605 |
Micro Ether |
VM |
MERA Curncy |
899 |
982 |
26,699 |
Other US Indices |
|
|
15,599 |
7,061 |
359,515 |
Futures |
|
|
2,491 |
5,111 |
108,071 |
Source: CME Group
*Through June 30, 2023
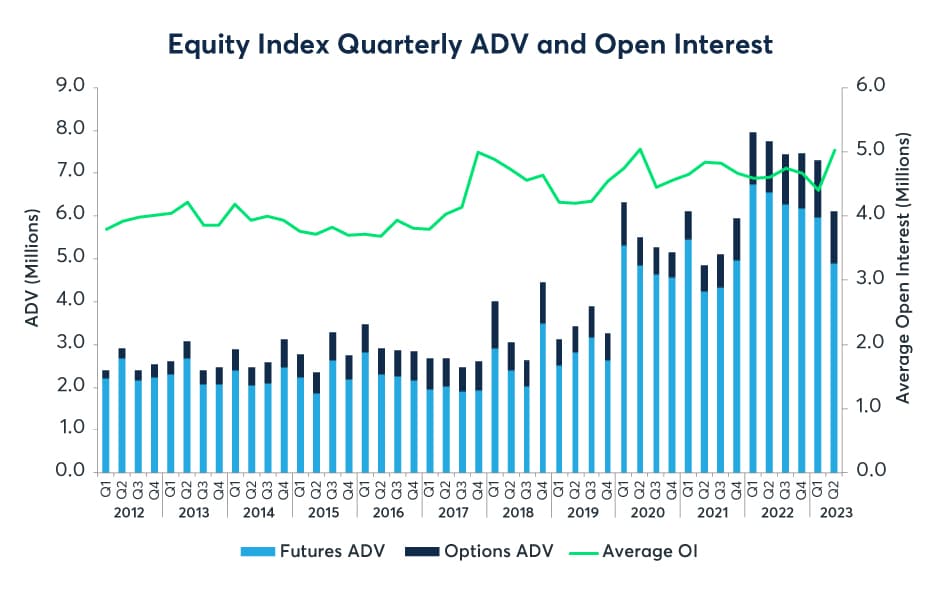
- Equity Index futures and options volume averaged 6.9M contracts per day in June 2023 (+14% vs. May-2023)
- Equity Index open interest averaged 11.1M contracts per day for the month of June 2023 (+4% vs. May-2023)
Source: CME Group
Ether/Bitcoin Ratio futures launching July 31*, enables traders to capture the relative value of Ether and Bitcoin in a single transaction. The new contract will be cash-settled based on the settlement prices of the corresponding futures contracts. Like inter-commodity spreads, ratio futures can help maintain price alignment between the two underlying contracts, potentially improving the bid-ask spreads for the outright contracts. Learn More Here:
FAQ
*Pending Regulatory Review
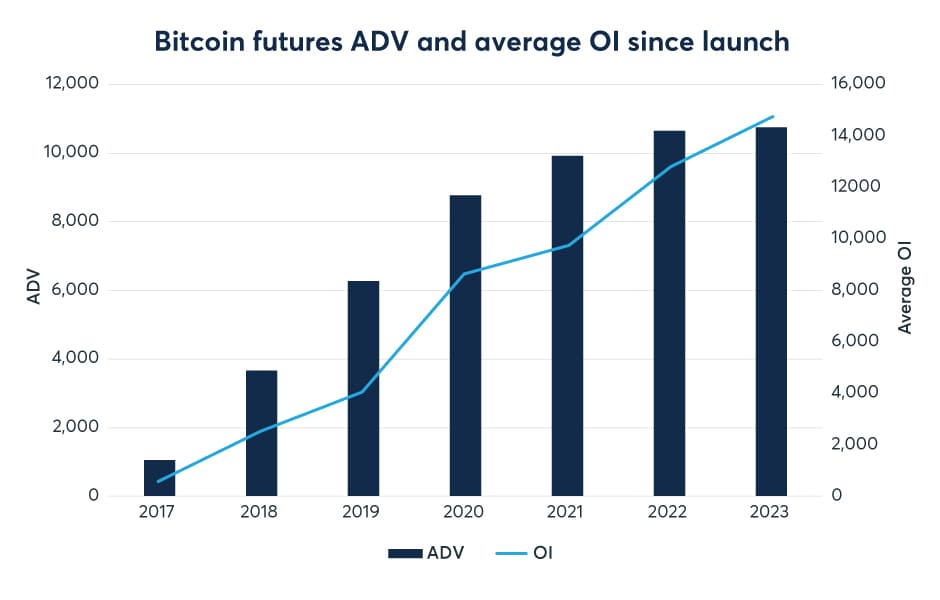
Bitcoin futures and options: Institutional interest remains strong as investors continue to seek regulated venues/products to hedge rising market volatility and manage risk/exposure. Futures trading in June averaged 12.3K (+25% vs. May-23) and open interest averaged 15.1K (15% vs. May-23). Bitcoin options have traded nearly 135K since launch, average OI was 8.7K in June.
Source: CME Group
Micro Bitcoin futures: Micro Bitcoin futures have traded over 8.7M contracts since launching in May 2021. The futures are 1/10 of a Bitcoin and settled to the CF Bitcoin Reference Rate. June ADV was 11.7K (+22% vs. May-23) and OI averaged 9K.
Micro Bitcoin and Micro Ether options: CME Group introduced options on Micro Bitcoin futures and options on Micro Ether futures on March 28. The options are right-sized at 1/10th of their respective tokens. Now, over 600K contracts have traded since launch across the various expiries with trades submitted from EMEA, APAC, and North America. New expiries are now available to enjoy greater precision and versatility in managing short-term Bitcoin and Ether risk with the expansion of weekly options expiries across our Cryptocurrency options suite. Learn more here:
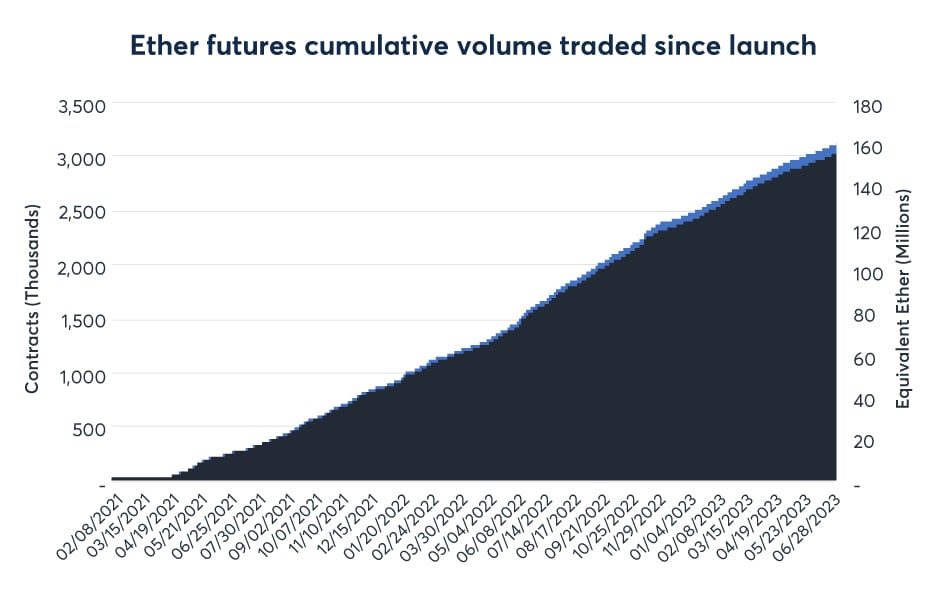
Ether futures: CME Group launched Ether futures on February 8, 2021. The contract is cash-settled and based on the regulated CME CF Ether-Dollar Reference Rate. Over 3.1M CME Ether futures contracts have traded since launch (equivalent to 156M Ether). June ADV was 4.6K (+16% vs. May-23) and open interest averaged 3.7K (+12% vs. May-23).
Ether options: Launched on September 12, Ether options offer another way to efficiently manage Ether exposure at 50 timesmultiplier. Over 10K contracts have traded since launch, equivalent to over 500K Ether. June OI averaged a record 2.2K. Learn more here:
Micro Ether futures: Since launching in December 2021, nearly 6.2M contracts have traded. ADV in June was 8K (+4% vs. May-23) and OI averaged 16.9K (+9% vs. May-23). Sized at 1/10 of one Ether, the contract provides an efficient, cost-effective way to manage exposure to one of the largest cryptocurrencies by market capitalization. Enjoy the same features of the larger Ether futures (ETH) at a fraction of the size, settled to the regulated CME CF Ether-Dollar Reference Rate.
Bitcoin Euro and Ether Euro futures: CME Group launched Bitcoin Euro and Ether Euro futures on August 29. The new contracts are designed to match that of their U.S.-denominated counterparts at 5 Bitcoin or 50 Ether per contract. The contracts will settle to the respective CME CF Bitcoin-Euro Reference Rate (BTCEUR_RR) and CME CF Ether-Euro Reference Rate (ETHEUR_RR). Learn more here:
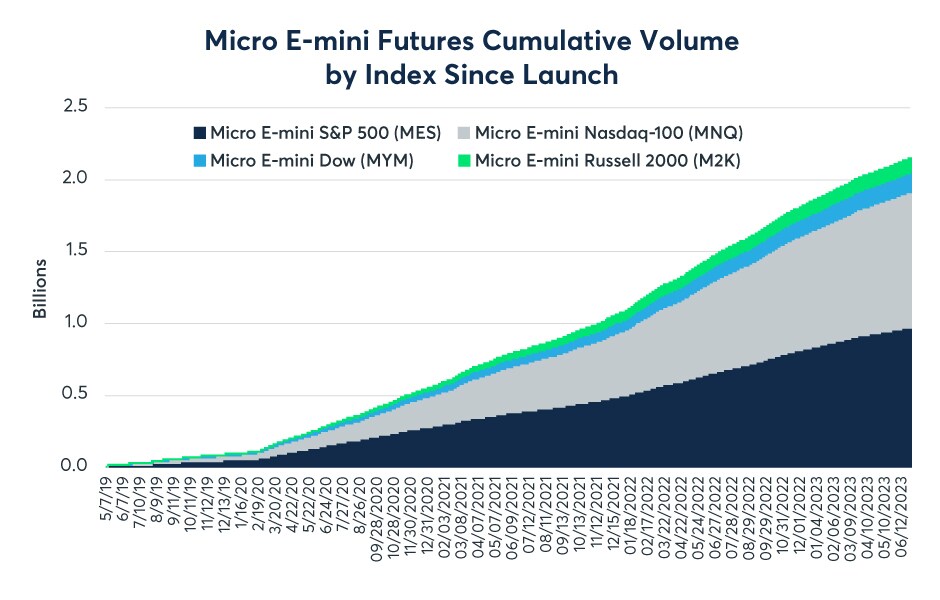
Micro E-mini futures: Nearly 2.2M Micro E-mini Equity Index futures contracts have traded since launch. Combined ADV in June was 2.1M (+1% vs. May-23). Now trade Micro E-mini S&P MidCap 400 and SmallCap 600 futures, which launched March 20. Learn more here:
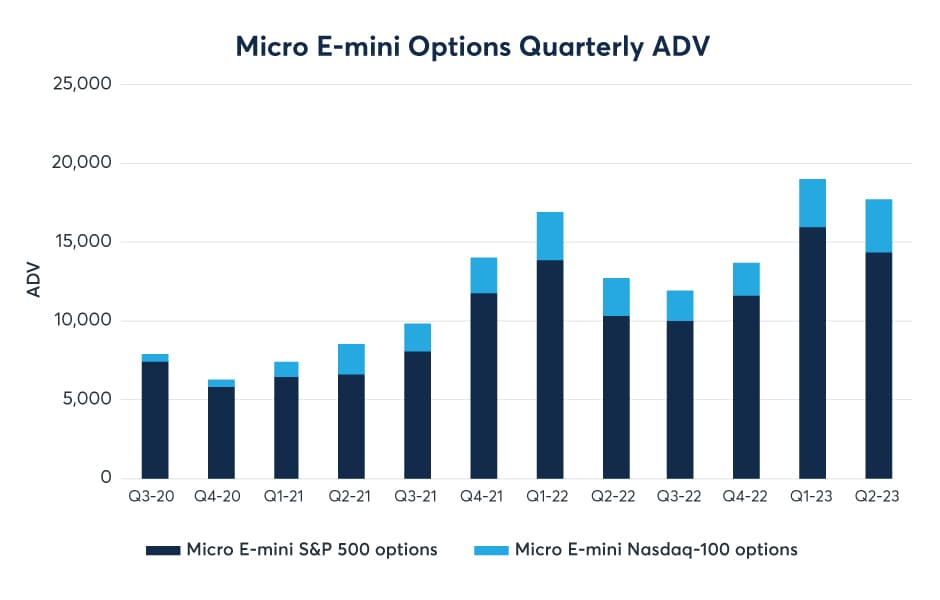
Micro E-mini options: CME Group launched Micro E-mini options on the S&P 500 and Nasdaq-100 indices in 2020. Micro E-mini Nasdaq-100 options continue to gain ground against their Micro E-mini S&P 500 option counterpart in terms of volume contribution. Since launch, nearly 7.9M contracts have traded, with the June ADV being 18.3K.
Now enjoy greater precision and versatility in managing short-term exposure with the introduction of Micro E-mini S&P 500 and Nasdaq-100 Monday, Tuesday, Wednesday, and Thursday options which launched on February 13. These new contracts complement the existing Friday weekly, end-of-month, and quarterly options on Micro E-mini S&P 500 and Nasdaq-100 futures. Learn more here:
Source: CME Group
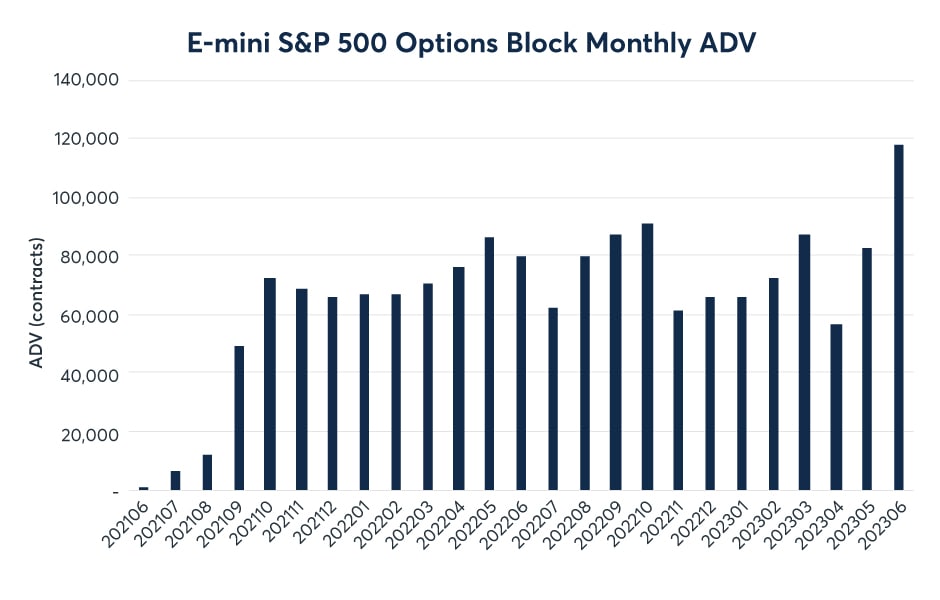
E-mini S&P 500 option blocks: Participation in ES options blocks continues to grow, allowing market participants to execute large trades with greater efficiency. Nearly 40M ES options blocks have traded, with the June ADV at 118K contracts (+42% vs. May-23).
NQ options became block eligible starting in January 2022, with a minimum block threshold of 60 contracts. Over 39K contracts have traded since eligibility.
Source: CME Group
AIR Total Return futures: Launched in September 2020, S&P 500 AIR TRFs offer clients a listed alternative to trading OTC swaps. Client adoption continues to gain momentum as the UMR deadlines approach. ADV in June was a record 8.2K (+200% vs. May-23) and OI averaged a record 345K (+4% vs. May-23) for the month. OI reached a record 366,861 at the end of the June roll, while Russell 2000 AIR TRF has been seeing increased trading.

Source: CME Group
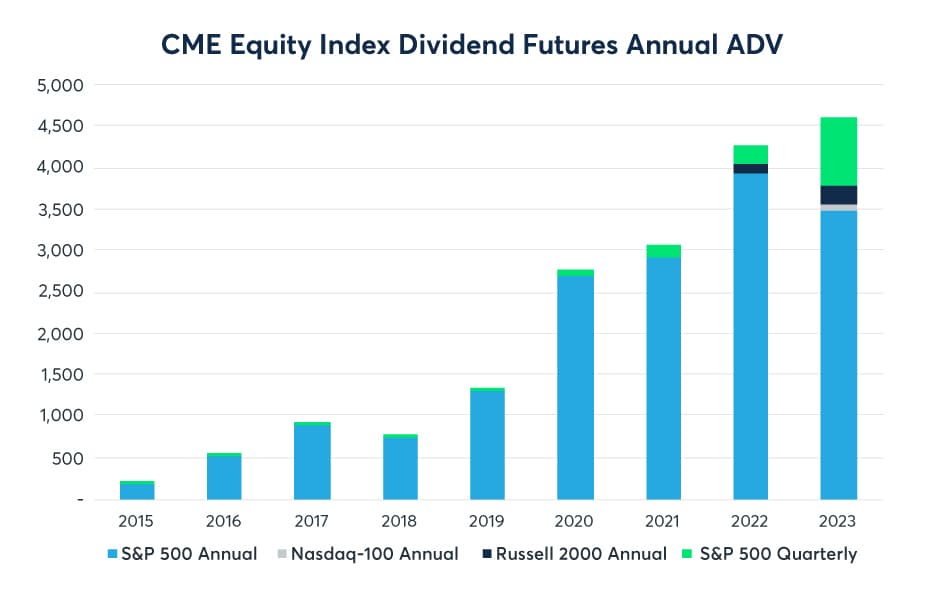
Dividend futures: CME Dividend futures combined June ADV was 3.9K. S&P 500 Annual Dividend Index futures June ADV was 3.1K. Nearly 62K contracts have traded since the launch of CME Annual Dividend Index futures on Nasdaq-100 and Russell 2000 in early 2022.
Source: CME Group
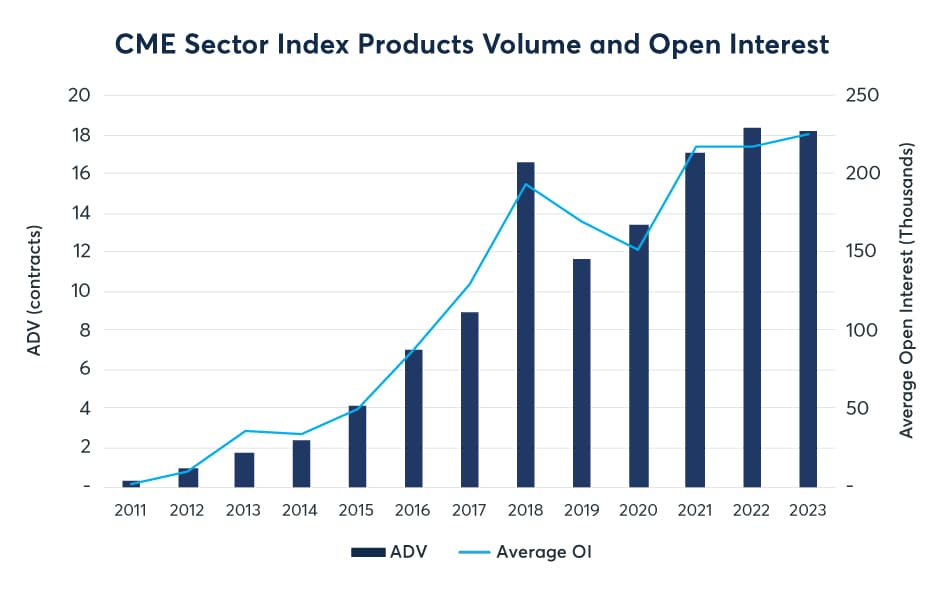
Equity Sector futures: CME Equity Sectors futures June ADV was 32K (+220% vs. May-23) and average OI was 245K (+13% vs. May-2023). The market has embraced derived block functionality introduced last year, with nearly 271K contracts traded since their launch across the various sector products.
Source: CME Group
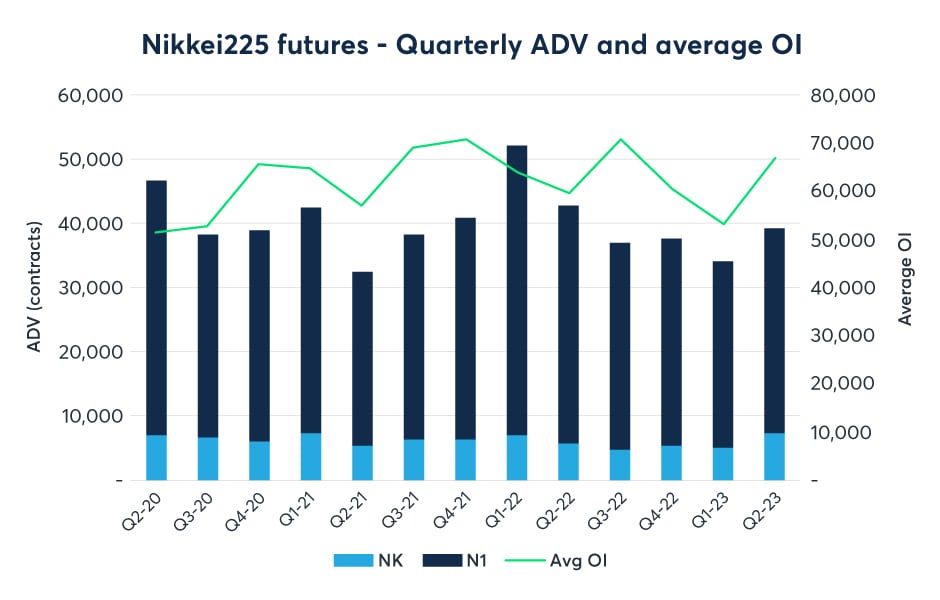
TOPIX futures: Launched on November 21, 2022, USD-denominated TOPIX Index futures provide market participants a new way to capture benchmark Japanese equity exposure while minimizing FX risk. This is the first USD-denominated TOPIX futures contract, which complements the existing yen-denominated TOPIX contract and provides trading opportunities in different currencies. Achieve capital efficient exposure by saving on potential margin offsets against other Equity Index futures at CME Group. Traders can utilize the dynamic quanto spreading opportunities between the yen- and USD-denominated TOPIX contracts created by the JPY/USD exchange rate. Access trading through outrights electronically on CME Globex, capture the certainty of the close using Basis Trade at Index Close (BTIC), or bilaterally negotiate EFP transactions.
Japanese equities broke away towards the end of the quarter reaching new highs. June saw an ADV of 45.2K and 11.9K in Nikkei225 Yen and USD, levels not seen since March 2020 and March 2022.
Learn more here:
Source: CME Group
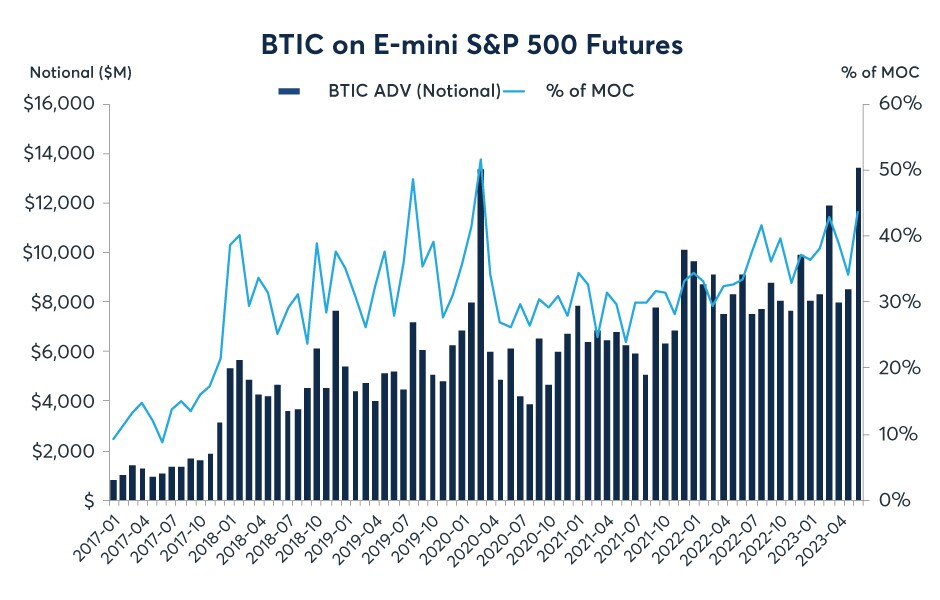
BTIC on Equity futures: CME Group Basis Trade at Index Close (BTIC) transactions on E-mini S&P 500 futures continue to trade near record highs, June E-mini S&P 500 ADV was 61K contracts ($13.4B). Utilize BTIC transactions to bridge between cash index close and the futures market daily or use BTIC+ days in advance.
Equity Index Products
Explore CME Group's suite of Equity Index products on U.S. and International Indices, Select Sectors, and Options on Futures.
Case Study: Navigating the Selection of Equity Indices in Times of Dispersion
Discover the significance of index selection during periods of dispersion in this insightful case study, which discusses the impact on choosing the right index.
Webinar: Navigating Opportunities in Commodity Index Trading
Tune into CME Group's webinar to get insights on the commodity market and how investors are allocating Commodity Index products into their portfolio.
Select the right U.S. Equity Index
Discover expert insights and analysis to help you choose the most suitable U.S. equity index for your investment goals.
