Learn about the 1:1 Crack Spread
In the petroleum industry, refinery executives are most concerned about hedging the difference between their input costs and output prices. Refiners’ profits are tied directly to the spread, or difference, between the price of crude oil and the prices of refined products: gasoline and distillates (diesel and jet fuel).
This spread is referred to as a crack spread due to the refining process that cracks crude oil into its major refined products.
The Role of the Crack Spread
A petroleum refiner, like most manufacturers, is caught between two markets: the raw materials he needs to purchase and the finished products he offers for sale. The price of crude oil and its principal refined products are often independently subject to variables of supply, demand, production economics, environmental regulations and other factors. As such, refiners and non-integrated marketers can be at enormous risk when the price of crude oil rises while the prices of the refined products remain stable or decline.
Such a situation can severely narrow the crack spread, which represents the profit margin a refiner realizes when he procures crude oil while simultaneously selling the refined products into a competitive market. Because refiners are on both sides of the market at once, their exposure to market risk can be greater than that incurred by companies who simply sell crude oil, or sell products to the wholesale and retail markets.
In addition to covering the operational and fixed costs of operating the refinery, refiners desire to achieve a rate of return on invested assets. Because refiners can reliably predict their costs, other than crude oil, an uncertain crack spread can considerably cloud understanding of their true financial exposure.
Further, the investor community may use crack spread trades as a hedge against a refining company’s equity value. Other professional traders may consider using crack spreads as a directional trade as part of their energy portfolio, with the added benefit of its low margins (the crack spread trade receives a substantial spread credit for margining purposes). Together with other indicators, such as crude oil inventories and refinery utilization rates, shifts in crack spreads or refining margins can help investors get a better sense of where some companies, and the oil market, may be headed in the near term.
Simple 1:1 Crack Spread
The most common type of crack spread is the simple 1:1 crack spread, which represents the refinery profit margin between the refined products (gasoline or diesel) and crude oil. The crack spread, the theoretical refining margin, is executed by selling the refined products futures and buying crude oil futures, thereby locking in the differential between the refined products and crude oil.
The crack spread is quoted in dollars per barrel; since crude oil is quoted in dollars per barrel and the refined products are quoted in cents per gallon, diesel and gasoline prices must be converted to dollars per barrel by multiplying the cents-per-gallon price by 42 (there are 42 gallons in a barrel).
If the refined product value is higher than the price of the crude oil, the cracking margin is positive. Conversely, if the refined product value is less than that of crude oil, then the gross cracking margin is negative.
When refiners look to hedge their crack spread risk, they are typically naturally long the crack spread as they continuously buy crude oil and sell refined products. If refiners expect crude oil prices to hold steady, or rise somewhat, while products prices fall (a declining crack spread), the refiners would sell the crack; that is, they would sell Gasoline or Diesel (ULSD) futures and buy Crude Oil futures. Whether a hedger is selling the crack or buying the crack reflects what is done on the product side of the spread, traditionally, the premium side of the spread.
CME Group offers a Crack Spread Conversion Calculator
EXAMPLE OF 1:1 CRACK SPREAD
In January, a refiner reviews his crude oil acquisition strategy and his potential gasoline margins for the spring. He sees that gasoline prices are strong, and plans a two-month crude-to-gasoline spread strategy that will allow him to lock in his margins. In January, the spread between April crude oil futures at $50.00 per barrel and May RBOB gasoline futures at $1.60 per gallon or $67.20 per barrel, presents what the refiner believes to be a favorable 1-to-1 crack spread of $17.20 per barrel.
Typically, refiners purchase crude oil for processing in a particular month and sell the refined products one month later.
The refiner decides to sell the crack spread by selling RBOB Gasoline futures and buying Crude Oil futures, thereby locking in the $17.20 per barrel crack spread value. He executes this by selling May RBOB Gasoline futures at $1.60 per gallon or $67.20 per barrel, and buying April Crude Oil futures at $50.00 per barrel.
Two months later, in March, we see prices have risen.
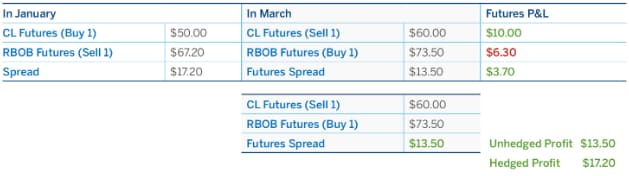
The refiner now purchases the crude oil at $60.00 per barrel in the cash market for refining into products. At the same time, he also sells gasoline from his existing stock in the cash market for $1.75 per gallon, or $73.50 per barrel. His crack spread value in the cash market has declined since January, and is now $13.50 per barrel
Since the futures market reflects the cash market, April Crude Oil futures are also selling at $60.00 per barrel in March — $10 more than when he purchased them. May RBOB Gasoline futures are also trading higher at $1.75 per gallon or $73.50 per barrel.
To complete the crack spread transaction, the refiner buys back the crack spread by first repurchasing the Gasoline futures he sold in January, and he also sells back the Crude Oil futures. The refiner locks in a $3.70 per barrel profit on this crack spread futures trade.
The refiner has successfully locked in a crack spread of $17.20. The futures gain of $3.70 is added to the cash market cracking margin of $13.50.
Had the refiner been un-hedged, his cracking margin would have been limited to the $13.50 gain he had in the cash market. Instead, combined with the futures gain, his final net cracking margin with the hedge is $17.20 — the favorable margin he originally sought in January.