User Help System
Futures Volume
Configure the dashboard for Futures Volumes display:

The Futures Volume tab offers two additional configuration options:
Volume Plot
The traded volume chart can be displayed in terms of the number of contracts traded, the $US value or the percentage of volume observed in each time period.
Contract
Use this option to display the spread and volume data for either the most active contract month (typically the front quarterly contract) or all contract months blended.
Types of Analysis
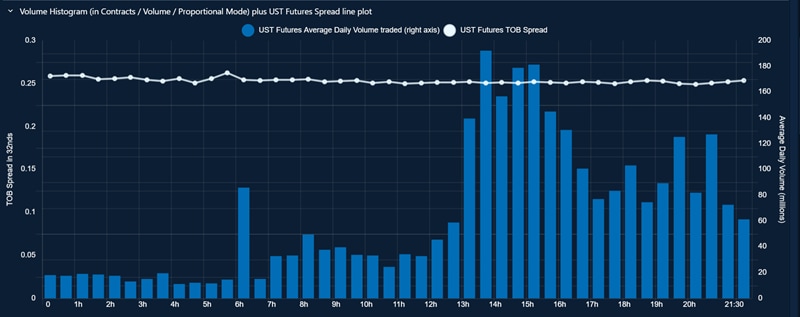
Volume Histogram (in Contracts / Volume / Proportional Mode) plus UST Futures Spread line plot

- Plots the traded volume for UST Futures.
- Overlays the bid-ask spread for the selected orderbook levels in 32nds.
- Depending on the volume plot selections:
- Contract will display the traded volume in terms of the number of contracts traded
- Volume will display the US dollar traded volume
- Proportional will display as a percentage of the traded volume for that day
UST Futures TOB Spread Distribution in 32nds (Percentile Box plot, 50% of the time within the Blue Box, Boundaries 10th and 90th Percentiles)

A box-whiskers (percentile) plot that buckets TOB UST Futures spread in 32nds into an hourly statistical plot. The median spread is shown in orange. The grey box highlights the range observed 50% of the time between the 10th and 90th percentiles.
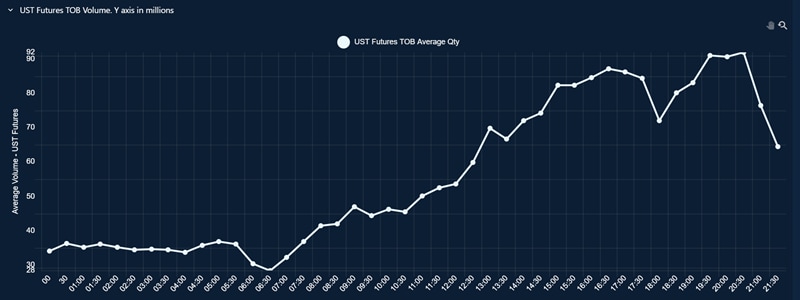
UST Futures TOB Volume. Y axis in millions

A plot of the UST Futures orderbook volume for the selected orderbook levels.


