User Help System
LP Alpha Report
1 Introduction
The LP Alpha Report dashboard is aimed at LP (Liquidity Provider) clients’ comparative analysis of instantaneous added value provided to their Liquidity Consumers along with Reject Rates, Cost of Rejects, and LP Hold times on orders, all compared to EBS Averages. This dashboard is designed to assist the LPs to focus on competitiveness of their prices to the LCs and any costs LCs incur because of Rejects. It also allows the LPs to compare an LP’s hold times with other Providers on EBS. The dashboard also allows an order by order breakdown of the full Transaction Cost Analysis (TCA). The data is exportable to Excel and shows next best prices available for each successful match as well as comparison to EBSM best liquidity at that point of time.
Users can quickly identify where they may be adding least value to clients and look to remedy negative situations quickly or modify pricing tiers and behaviors. High Alpha values and low volumes may suggest pricing is too wide and more opportunities could be made by tightening (depending on pricing competitiveness, if LP Market share is high it could be overstating Alpha, if LP Market Impact is also high, pricing should be actually widened), too low gross alpha could suggest very non-differentiated pricing or over skewing.
Note: All report screenshots shown here are using hidden floor and institution codes, for illustration purposes only and to show functionality (actual Floor Codes and Institution codes are four character alphanumeric codes).
2 Configuration
Configuration of the views consists of the following:
- Selection of the groupings used to display data
- Setting filters to select trade data
- (Optionally) selecting additional data
2.1 Display View Selection
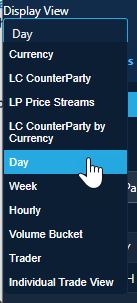
The Display Views determine how the trade data is grouped. Each of these groupings is detailed in Data Display. Options include:
- Currency
- LC CounterParty
- LP Price Streams
- LC CounterParty by Currency
- Day
- Week
- Hourly
- Volume Bucket
- Trader
- Individual Trade View
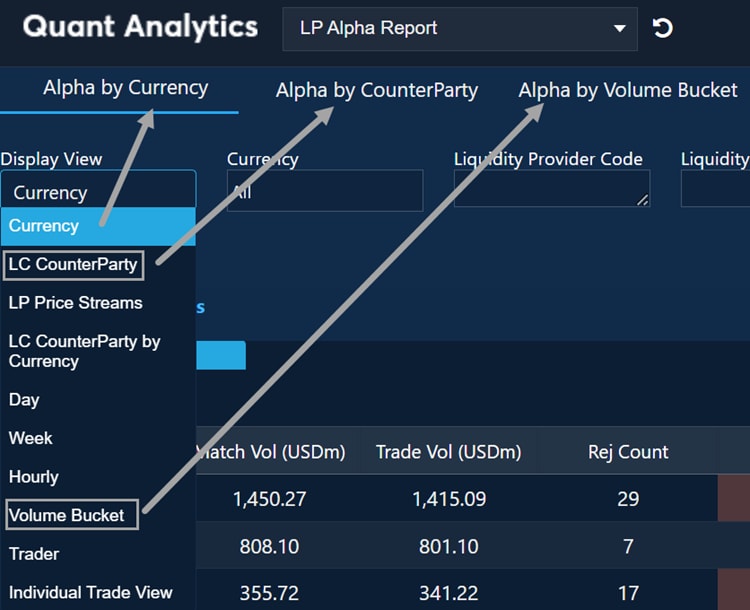
The Display view can either be selected from the Display View dropdown or by the Quick Display View Bar.
- To select views from the display view dropdown
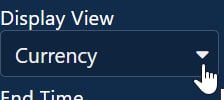
- Click the arrow in the Currency box to see a list of view options. The default view is Currency.
- Scroll the list to choose a display option.
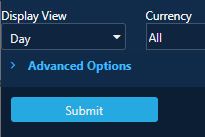
- Click Submit to confirm.
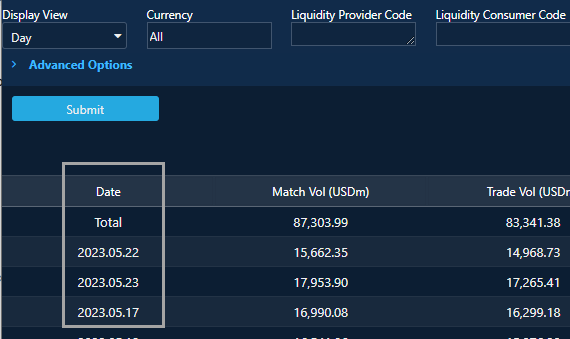
The data will display by the selected grouping.
- To use the Quick Display Views
Three of most commonly used views can be accessed using the short-cut links.
Click a Display View Quick link to quickly navigate to that view.
- View by Currency (Display View “Currency”)
- View by CounterParty (Display View “LC CounterParty”)
- View by Volume Bucket (Display View “Volume Bucket”)
The active view is indicated by a blue line.
2.2 Data Filters
Each main display view has options for filtering the data presented. Refer to the sections that follow for details.

2.2.1 Currency
Allows user to specify Currency for analysis, not case sensitive.
NOTE: Default value is TOP10 – Top 10 EBS currency pairs (based on volume).
Type the following Shortcodes+ Submit for groups of currencies as follows:
- ALL – will display the full list of currency pairs available on EBS.
- Individual Currency Pairs (Syms) – Can enter single pairs (e.g. EURUSD) or multiple pairs, delimited by commas (e.g. EURUSD, USDJPY, USDCNH).
- Individual Currencies (Syms) - Can enter single currencies (e.g AUD) and see all currencies with AUD in them, (e.g. AUDUSD, AUDJPY, AUDCAD, etc.).
- TOP5 – Top 5 EBS currency pairs
- NDF – will display NDF currency pairs
- Skandi or Scandi – will display all scandi currencies, EM, LATAM, AEM for emerging markets
- Com – Will display all commonwealth currencies
2.2.2 Liquidity Provider Code
Allows inclusion / exclusion (using “!”) of your individual LP Floor ID, or Institution code, or multiple IDs:
- Default is “”, meaning all
- Enter floor code or institution code, can be blank (does not need “ ”)
- Can use Wildcards, e.g. T*** to select all floors starting with T
- Can use Exclusion, e.g. !T*** to exclude all floors starting with T
- Can choose multiple Floors separated by a comma
- Floor codes are not case sensitive
- Only LP Codes are available
2.2.3 Liquidity Consumer Code
Allows entry / or exclusion (using “!”) of individual Floor ID or institution, or multiple IDs:
- Default is “”, meaning all
- Allowed values follow same logic as for LP Code field
2.2.4 Start Date/End Date
Filter date ranges for the data displayed using the drop-down calendar.
2.2.5 Start Time/End Time
Specify time ranges for the data displayed.
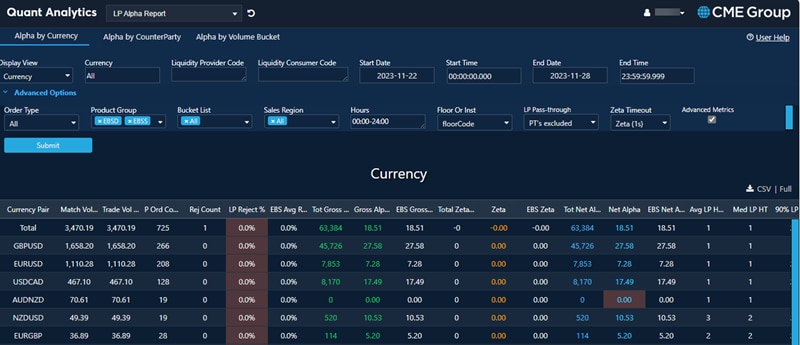
2.2.6 > Advanced Options
Click this option to see more advanced view options and features.

Expanded View

2.2.7 Order Type
Allows selection of Single Ticket / Sweep or both from drop down.
2.2.8 Product Group
Allows user to select trading style:
- EBSD (EBS Direct – disclosed relationship trading)
- EBSS (EBS Select – non-disclosed relationship trading)
Click in Product Group field to display and select options. By default, both EBSD, EBSS are selected.

2.2.9 Bucket List
The volume buckets for the size of individual orders included in the report:
- All
- 1: <=1m
- 2: 1-3m
- 3: 3-5m
- 4: 5-10m
- 5: 10-15m
- 6: 15-20m
- 7: 20-30m
- 8: 30-50m
- 9: 50m
2.2.10 Sales Region
- All
- Americas
- Asia & Oceania
- Japan
- EMEA
2.2.11 Hours
Reports trades occurring within these hours only. Start Date + Start Time and End Date + End Time determine the start and end of the overall reporting period. Hours determines the hours for each day within the reporting period for which trades will be reported.
2.2.12 Floor or Inst
Defines the granularity of reporting against the LP:
- instCode: reporting is aggregated to the LP's instcode (but still broken down by LC Floor codes)
- floorCode: reporting is broken down by LP's floorCodes (and LC floor codes)
- priceSegment: reporting is broken down by LP's price segment (and LC floor codes)
Note: this controls the display of data not the selection of data and only applies to the following Display Views:
- LC Counterparty
- LP Price Streams
- LC Counterparty by Currency
- Trader
2.2.13 LP-Pass Through
Whether or not pass through orders are included in the reports. By default they are excluded since they are no subject to competitive matching.
2.2.14 Zeta Timeout
The delay used to calculate zeta values (see Total Zeta (USD) column).
2.3 Advanced Metrics
Allows user to view more columns of data including additional LP hold time data. Check to activate, then press Submit. See Advanced Columns for more information.

3 Data Display
3.1 Data Columns
3.1.1 Data Columns Common to Alpha Display Views
The table below displays columns of data are shared by all the display views except Individual Trade View. For additional metrics, refer to the Advanced Columns section.
| Column | Metric | Description |
|---|---|---|
| Match Vol (USD m) |
Matched Volume |
The volume has been matched by EBS and sent to you as proposed trades. Note that volumes are converted into USD equivalent for reporting. |
| Trade Vol (USD m) |
Traded Volume |
The volume you have traded with your LCs in total and by selected display view. |
| Rej Count | Count of Rejects | The number of times Trade Proposals have been rejected by you. This is how many times in the selected time you rejected proposed trades from LCs. |
| LP Rej % | LP Reject Percentage | This is the ratio of your Rejects to proposed trade volume, "What is the proportion of proposed volume rejected by you?" The three highest reject ratios are highlighted. |
| EBS Avg LP Rej | EBS Average LP Reject | The EBS Average Reject ratio based on the blend of Currencies and Volumes proposed to you. "What is the proportion of Rejected trades for other LPs. This is based on similar trade attempts to the ones received by you. Are you Rejecting more or less than most LPs?" |
| Net Alpha | Net Alpha (USD per mil) | Average benefit per million of matched volume gained from matching with you and offset by costs of rejects to the LC. This is how much the LC benefits from having your price in the mix (taking into account both the price and cost of rejects) proportionate to all of the orders matched to you. The three lowest Net Alpha values are highlighted. |
| EBS Net Alpha |
EBS Net Alpha (USD per mil) |
Systemwide average benefit of better pricing for completed trades at time of match offset by Cost of Rejects and based on the blend of Currencies and Volumes matched to you. Do LCs benefit from having your price in the mix more or less than they do for others given your overall trading activity of the system. |
| LP Hold Times |
LP Hold times (ms) |
Average time in milliseconds it takes you to respond to Trade Proposals from LCs. |
3.1.2 Advanced Columns
These are the data columns that display when the Advanced Columns options is selected.
| Column | Metric | Description |
|---|---|---|
| P Ord Count |
Parent Order Count |
The count of LCs of parent orders, involved in matches with you. |
| Tot Gross Alpha (USD) | Total Gross Alpha | Total benefit of your price to the LC at time of match. This is based on difference between the dealt price and the EBS Direct VWAP price for that LC at the time of the match if you were excluded from the price stack. If the EBS Market VWAP is better than the EBS Direct VWAP price then the EBS Market VWAP price is used instead. This is how much LC benefits by having you providing better price for their completed trades. |
| Gross Alpha | Gross Alpha (USD per mil) | Benefit of your price to the LC at the time of match per million of matched volume. This is how much LC benefits by having you in the price mix proportionate to all orders which got matched by you. |
| EBS Gross Alpha | EBS Gross Alpha (USD per mil) | Average benefit of better pricing at point of match received by all LCs on EBS system based on the blend of Currencies and Volumes traded by you. This is how much pricing from LPs which actually get the trade benefits most LCs proportionate to their matched volume and based on similar trades to you. "Do you provide more price benefit or less than other LPs given your overall trading activity on the system? |
| Total Zeta (USD) |
Total Zeta (USD) |
Total Cost of Rejects to LCs. This is based on the average trade price of any deals by the same LC in the same direction and currency pair within Zeta timeout seconds after you rejected a trade attempt with that LC and up to the amount of the rejected trade. If no deals took place or the total amount of deals is less than the reject amount, then the movement of the EBS True Rate at Zeta timeout seconds after the reject is used to allocate the cost. This is total your cost of your Rejects to your LCs. |
| Zeta |
Match Vol Zeta (USD per mil) |
Cost of Rejects per million of Matched Volume. This is how much Rejects are costing your LCs proportionate to all of LC orders which get matched on the System. |
| EBS Zeta | EBS Match Vol Zeta (USD per mil) | Average cost of Rejects per million of Matched Volume on EBS system based on blend of Currencies and Volumes proposed to you. This is how much LP Rejects costs to most LCs proportionate to their matched volume and based on similar trades to you. Do your Rejects result in higher average cost to LCs proportionate to their activity on the system? |
| Tot Net Alpha (USD) |
Total Net Alpha (USD) |
Total benefit at time of match gained from having your prices and offset by your Cost of Rejects to the LC. This is how much your LC benefits from having your price in the mix taking into account both the price quality and cost of rejects. |
| EBS Avg LP Hold Times |
EBS Average Hold Times |
average time in milliseconds (across the whole system) it takes LPs to respond to Trade Proposals for similar trades |
| Avg LP Hold Time | Average LP Hold Time | LP Hold Times: average time in milliseconds it takes LPs to respond to proposals from you |
| Med LP HT | Median LP Hold Time | LP Hold Times: median time in milliseconds it takes LPs to respond to proposals from you |
| 90% LP HT | 90% percentile LP Hold Time | LP Hold Times: 90th percentile time in milliseconds it takes LPs to respond to proposals from you |
| 99% LP HT | 99% percentile LP Hold Time | LP Hold Times: 99th percentile time in milliseconds it takes LPs to respond to proposals from you |
| Acc LP HT | Average LP hold time for filled trades | LP Hold Times: average time in milliseconds it takes LPs to accept proposals from you |
| Rej LP HT | Average LP hold time for rejected trades | LP Hold Times: average time in milliseconds it takes LPs to reject proposals from you |
3.2 Display Views
3.2.1 Display View: Currency
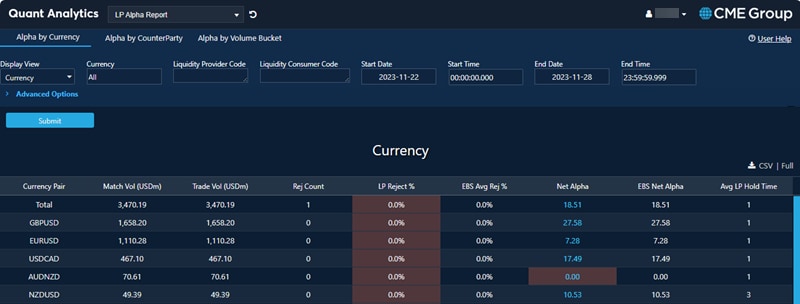
Default view is by Currency. This view displays information about the individual client and how they compare to the market, in general, in different Currency Pairs they traded. Default sort order is descending by Matched Volume.
- Drill down Floor by Floor or view by Institution codes that they have access to.
- To view the breakdown of your own floors use the LP Price Streams view.
Clients can drill down by one or more LCs by inputting their code into the LC code box selected (client can be empty or populated).
3.2.2 Display View: LC CounterParty
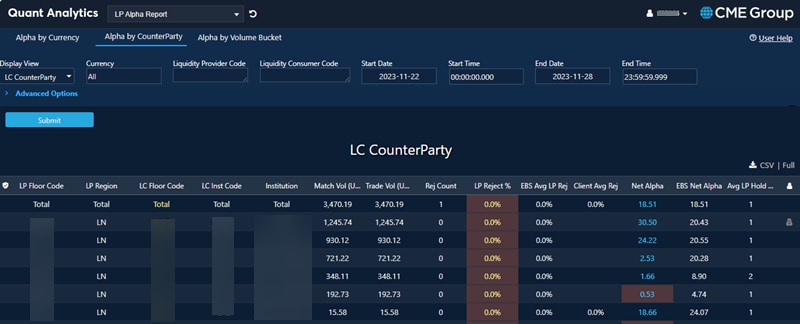
This view displays information per counterparty and how each counterparty compares to the market in general. Default sort order is descending by Matched Volume.
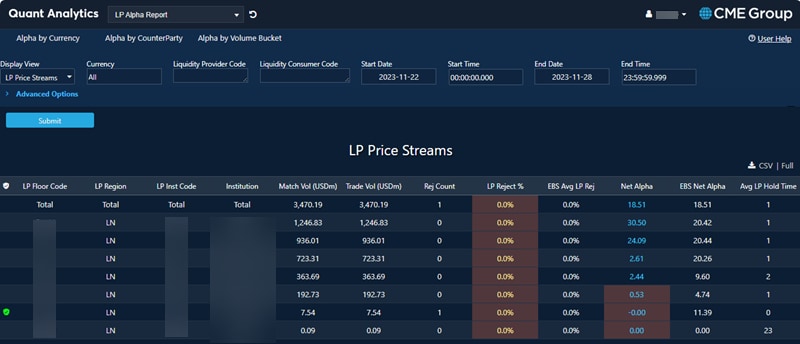
3.2.3 Display View: LP Price Streams
This view shows metrics per LP Price stream. Default sort order is by descending trade volume. Clients can drill down Floor by Floor or view by Institution codes that they have access to.
The columns are the same as in the LC Counterparty view.
3.2.4 Display View: LC CounterParty by Currency
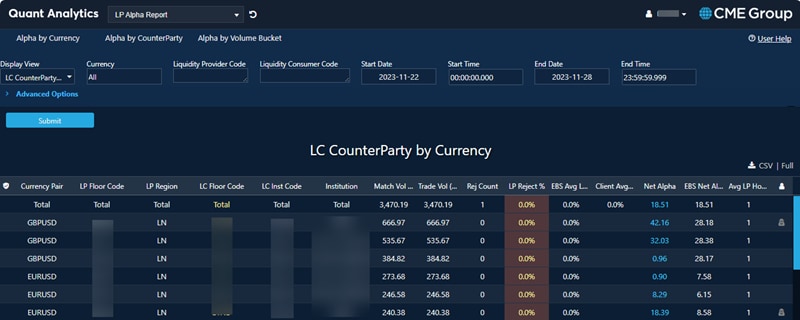
This view shows metrics per counterparty per currency. Default sort order is by descending Matched Volume.
The columns are the same as in the CounterParty View with the addition of the Currency column.
3.2.5 Display View: Day
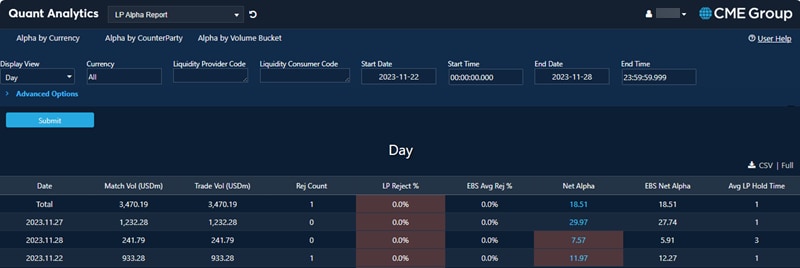
Shows data aggregated by day.
3.2.6 Display View: Week
Shows data aggregated by week.

3.2.7 Display View: Hourly
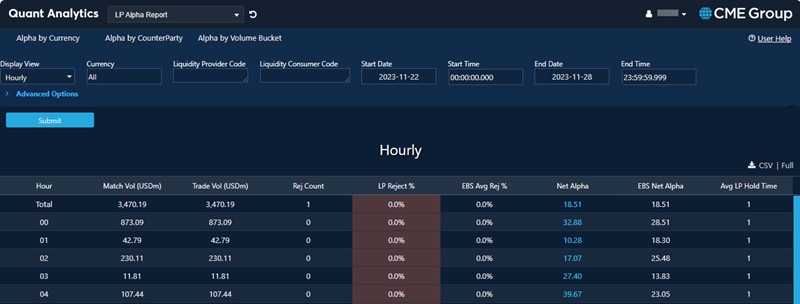
Shows data aggregated by hour.
3.2.8 Display View: Volume Bucket
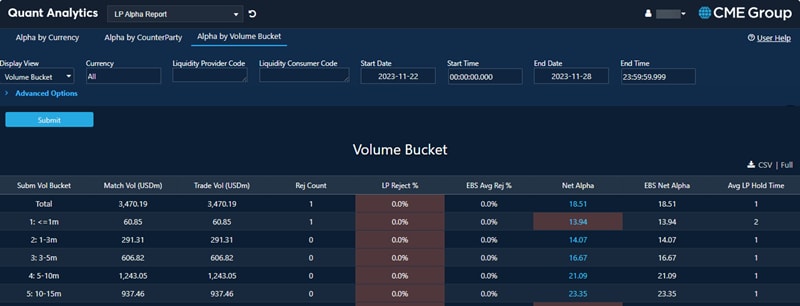
This view groups metrics by size (USD) of the LC Parent order which was submitted to EBS (including any un-matched volume). The default sort order is by Volume Bucket. Other columns are the same as in the Currency view.
3.2.9 Display View: Trader
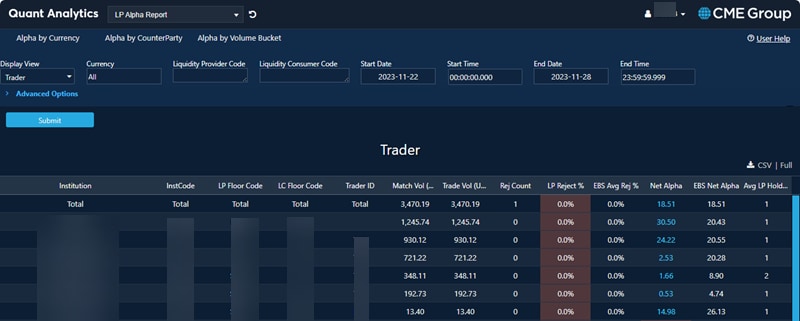
Produces report like LC CounterParty view but further split by Trader ID
3.2.10 Display View: Individual Trade View
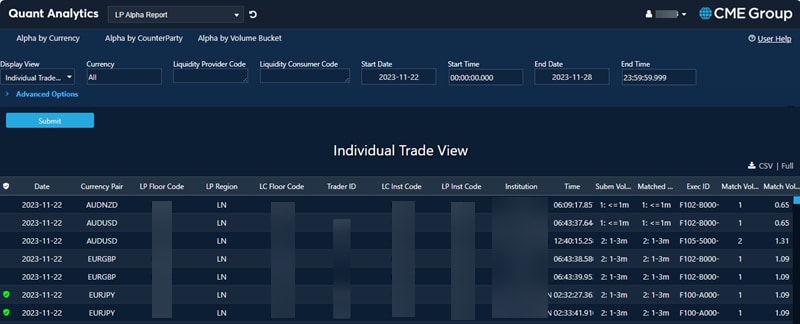
Produces a trade-by-trade view, which natively shows 6000 rows but can be fully exported to CSV (up to 1 million rows); shows all details for deeper custom analysis.
4 Other Features
4.1 Export Data
Export analytic results by going to the right corner above data table and clicking either CSV or Full (for a complete data set).

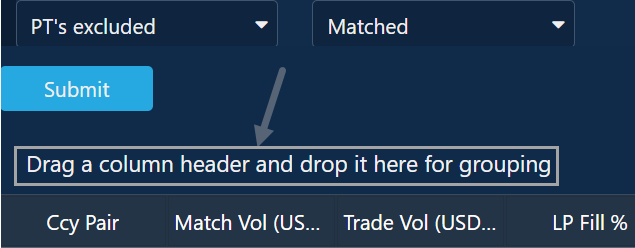
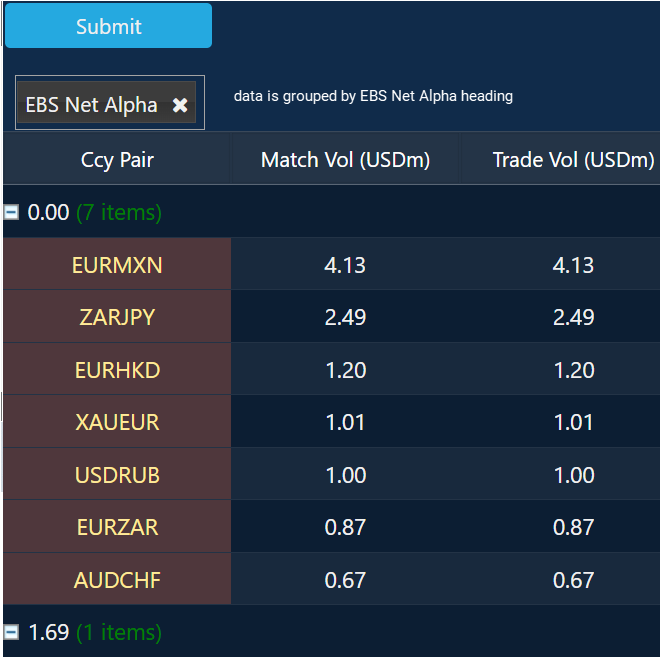
4.2 Drag a column header and drop it here for grouping
Group data by dragging column headings to the top of the chart.
5 Calculation Methodology
Only ESP flow is included while RFQ is excluded.
Orders submitted to the system are analysed first by being matched to each LP and identifying the subsequent Filled or Reject outcomes for each matched Order.
We start by calculating Gross Alpha value which serves as a measure of the benefit received from access to better prices provided by LPs. This is calculated as following:
- For each match attempt which resulted in a Deal we calculate the difference between actual Dealt price and the theoretical VWAP price with all other LPs available to that LC (assuming the matched LP is removed from the price stack). This serves as a measure of how much was gained by having a particular LP as part of the price stack. This is the value difference on the VWAP with the LP versus without them (single ticket trades are treated as separate VWAPs)
- We also measure the difference between the actual Dealt price and the theoretical VWAP price on the EBS Market Central Limit Order Book. The lower of this value and the value calculated in (a) is used to indicate Gross Alpha value for any given Deal. If the EBS Market VWAP is better than the actual Dealt price then a Gross Alpha of 0 is assigned to the Deal. This is done to remove outliers and make sure benefit is only allocated to LPs which provide competitive prices.
Next, we calculate theZeta metric which is the cost of rejects . This is calculated as one of the following:
- If the Parent Order was Fully Filled following the Reject event, then we take the average price of the Deals related to same Parent Order which took place after the Reject and calculate the difference from the price of the Rejected order. This methodology would only apply if the Parent Order has re-match logic enabled or is a Resting Order.
- If the Parent Order was not Fully Filled, and there were no Trades from the same Client in the subsequent one second time interval in the same Instrument and in the same Direction, then we look at the EBS True mid-rate at one second from the time of Reject and calculate the difference from the EBS True mid-rate at the time of Rejected Order. This gives an indication of the Market movement which occurred within one second following the unsuccessful trade attempt.
- If the Parent Order was not Fully Filled, but there were Trades from the same Client in the subsequent one second time interval in the same Instrument and in the same Direction which matched or exceeded the size of the average price of the Rejected order, then we take average price of these Deals and calculate the difference from the price of the Rejected.
- If the Parent Order was not Fully Filled, and there were Trades from the same Client in the subsequent one second time interval in the same Instrument and in the same Direction but their total was less than the size of the Rejected order, then we take a blend of deltas calculated using methods b) and c) above, weighted by volume.
Finally, we calculate the “Net Alpha values” by subtracting the Zeta value from the Gross Alpha thus providing a measure of the overall benefit of LP prices offset by Cost of Rejects.


