User Help System
LC Market Impact
This dashboard is focused solely on LC (Liquidity Consumer clients) analysis of their trades on EBS Direct (EBSD) and EBS Select (EBSS).
Trades are analyzed from trade point to mid-market (EBS True Rate: a blended rate of EBSM and EBSD prices when available), and forward 30 seconds from mid-rate showing pure market impact. Trade view is locked to taker perspective with several available dashboards, including Currency (Individual), LP Counterparty, LC Bank Codes, Day, Week, Hourly, Volume buckets and Trader.
Our analytics services allow clients to better manage and maintain bilateral liquidity relationships and to measure their own activity against market averages on a like-for-like basis and also to directly compare liquidity partners on a peer-to-peer basis.
This comparative analysis allows clients to independently compare their level of market impact compared to all clients in our ecosystem as well as their traded spreads. It also allows clients to quantifiably determine the effectiveness of their LP mix amongst their trade activity from a market impact and spread.
The symmetrical sharing of information (to the LC and the LP via Quant Analytics) allows a neutral transparency of information between makers and takers so that both are informed and aware of the trade activity and its impact. This allows for better conversations and understanding to occur about liquidity relationships and helps facilitate the building of long term liquidity relationships.
Command List – LC Market Impact

Quick Display View Bar
Click the Display View Quick link button to quickly navigate to that market impact view. The active market view is indicated by a blue line.
The three display views are
- MI by Currency (Market Impact by Currency, Display View “Currency”)
- MI by Counterparty (Market Impact by Counterparty, Display View “LP Counterparty”)
- MI by Volume Bucket (Market Impact by Parent Order Volume Bucket traded, Display view “Volume Bucket”)

Display View – LC Market Impact
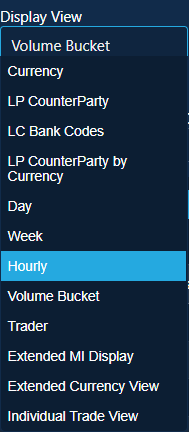
Allows the user to access dashboard features by choosing from various analytic views on the drop down.
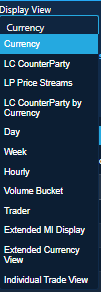
- All MTM, Market Impact and Retained Spread numbers are in USD per million
- Options for display view include:
- Currency: shows LC Market Impact by Currency (default view)
- LP CounterParty: shows the Market Impact per Liquidity Provider counter party
- LP Price Streams
- LC CounterParty by Currency
- Day
- Week
- Hourly
- Volume Bucket
- Trader
- Extended MI Display
- Extended Currency View
- Individual Trade View
Note:
• A loading sign will appear in the middle of the dashboard when loading dates. There are rules on how much data can be queried at any one time.
• All MTM, Market Impact and Retained Spread numbers are in USD per million.
• Not case sensitive.
• Click on any header column and sort in ascending or descending order; this preference is not saved or persisted when re-opening a dashboard.
Currency
Allows user to specify Currency for analysis, not case sensitive.
Shortcodes for groups of currencies are as follows:
- Default value is TOP10 – Top 10 EBS currency pairs (based on volume).
- ALL – Will display the full list of currency pairs available on EBS.
- Individual Currency Pairs (Syms) – Can enter single pairs (e.g. EURUSD) or multiple pairs, delimited by commas (e.g. EURUSD,USDJPY,USDCNH)
- Individual Currencies (Syms) - Can enter single currencies (e.g AUD) and see all currencies with AUD in them, (e.g. AUDUSD, AUDJPY, AUDCAD, etc.)
- TOP5 – Top 5 EBS currency pairs
- NDF – Will display NDF currency pairs
- Skandi or Scandi – Will display all scandi currencies, EM, LATAM, AEM for emerging markets
- Com – Will display all commonwealth currencies.
Start Date/End Date
Specify dates from the drop-down calendar for the data desired.
Liquidity Consumer Code
Allows inclusion / exclusion (using “!”) of user's individual LP Floor ID, or Institution code, or multiple IDs:
- Default is “”, meaning all,
- Enter floor code or institution code, can be blank (does not need “ ”)
- Can use Wildcards, e.g. T*** to select all floors starting with T
- Can use Exclusion, e.g. !T*** to exclude all floors starting with T
- Can choose multiple Floors separated by a comma
- Floor codes are not case sensitive
- Only LP Codes are available
Liquidity Provider Code
Allows entry / or exclusion (using “!”) of individual Floor ID or institution, or multiple Id’s:
- Default is “”, meaning all
- Allowed values follow same logic as for LC Code Order Type
>Advanced Options
Clicking on this allows the user to see more advanced views and features

Expanded View

Trader
Allows selection of Single or Multiple Trader ID.
Order Type
Allows selection of Single Ticket / Sweep or both from drop down.
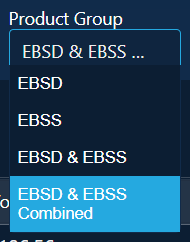
Product Group
Allows user to select trading style:
- EBSD (EBS Direct – disclosed relationship trading)
- EBSS (EBS Select – non-disclosed relationship trading)
Both EBSD, EBSS (Default) Click in Product Group field to display and select options.
Volume Bucket Metrics
Allows user to select extra fields for display to show largest volume bucket traded and average trade size. Check to activate, then press Submit.

Advanced Metrics
Option to view additional metrics. Check to activate, then press Submit.

Export Data
Export analytic results by going to the right corner above data table and clicking either CSV or Full (for a complete data set).

Display View: Currency
Default view showing the LC Market Impact by Currency. This view displays information about the individual client and how they compare to the market in general. Default sort order is descending by Volume.

| Column | Description |
|---|---|
| Currency Pair | The Currencies selected. |
| Trade Vol (USD m) | The USD volume you have traded with your LPs in total and by Currency. |
| Mark to Mid 0’s |
Amount you were charged on average in USD per million. LC mark to market on initial trades from traded price to mid-market at time of trade, mark to market at t0, it represents approximately 50% of the traded spreads on average. |
| EBS Average MTM 0’s |
Amount most LC’s across the whole EBS system were charged for similar trades compared to yours. Are you charged more or less than your peers? EBS Average Mark to Mid-market based on your blend of traded Currencies and Volumes. |
| MI from Mid 30s |
How the market moves when you trade with your LP’s. The LC’s average market impact at 30 seconds measured from mid-market at t0. |
| EBS Average MI 30s |
How the market moves when most Clients do similar trades; i.e. are you moving the market more or less? Does this align with what you are being charged? EBS Average MI at 30s based on your blend of traded Currencies and Volume. |
| Spread Retention 30s | How much your LP’s retain of their traded spread after 30 seconds. MTM at t0 minus MI from mid at 30s. |
| EBS Average Spread Retention at 30s |
How much most LP’s retain of their traded spread after 30s for similar trades. How sustainable is your flow with your liquidity providers? EBS Average MTM at t0 minus average MI at 30 sec based on your blend of traded Currencies and Volumes. |
| Large Trade % |
Shows at a glance the rough distribution of your parent orders. Are you trading more big tickets or less?” The percentage of your Parent orders that were greater than 5 mil USD. |
Display View: LP CounterParty
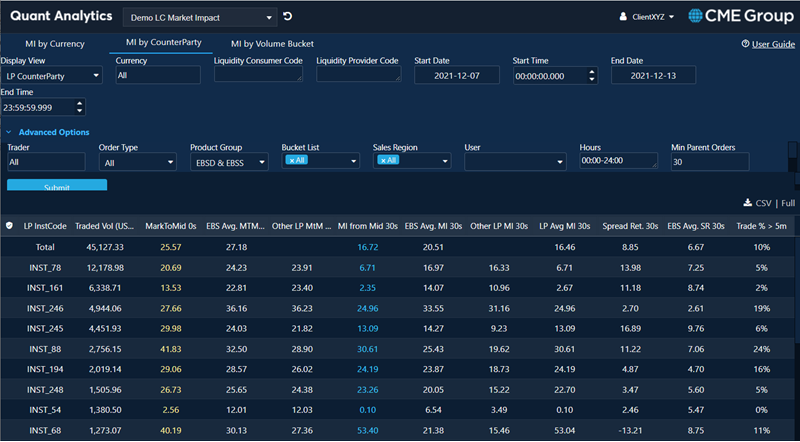
“LP Counterparty” shows the Market Impact per counterparty. Default sort order is by descending trade volume.
- Users can drill down Floor by Floor or view by Institution codes that they have access to
- Clients can see these codes by leaving the LP code box empty and changing display view to “LP Price Streams”
Clients can drill down by one or more LPs by inputting their code into the LP code box selected, (client can be empty or overridden).
Enter one Client and one or more Counterparty, e.g. Client_6149 client and INST_195, INST_193, shows all LP individual net volumes, spreads, retention, Market Impact and parent order analysis for just those LP trades.
| Column | Description |
|---|---|
| LP Institute Code | A single EBS code applied to multiple floors under an Institution. |
| LP Institution Name | The LP’s Disclosed trading name or non-disclosed ID tag. |
| Traded Vol (USD m) | The USD volume traded with each LP. |
| Mark to Mid 0‘s |
Amount you were charged on average by each LP. LC mark to market on initial trades from traded price to mid-market at time of trade, mark to market at t0, it represents approximately 50% of the traded spreads on average. |
| EBS Average MTM 0’s |
Amount most LC’s across the whole EBS system were charged for similar trades. Are you charged more or less than most? EBS Average Mark to Mid-market based on your blend of traded Currencies and Volumes traded with this LP |
| Other LP’s MTM 0’s (excluding this LP) |
What other LP’s you traded with charged you for similar trades. Do I cross more or less spread with this LP compared to my other LP’s? The Average MTM calculated from your trades with other LP’s, based on your traded Currencies and Volume blend with this LP. |
| MI from Mid 30s |
How the market moves when you trade with each LP. The LC’s average market impact at 30 sec measured from mid-market at t0 with this LP. |
| EBS Average MTM 30’s | How the market moves when most Clients do similar trades, are you moving the market or not? Does this align with what you are being charged?”How the market moves when most Clients do similar trades, are you moving the market or not? Does this align with what you are being charged?” EBS Average MI at 30 sec based on your traded Currencies and Volume blend with this LP. |
| Other LP’s MTM 30’s (excluding this LP) |
The market impact your other LP’s you traded with experienced for similar trades. Do my trades cause more or less market impact with this LP compared to my other LP’s? The Average market impact at 30 sec calculated from your trades with other LP’s, based on your traded Currencies and Volume blend with this LP. |
| Spread Retention 30s |
How much each of your LP’s retain of their traded spread after 30 seconds. MTM at t0 minus MI from mid at 30 sec. |
| EBS Average Spread retention at 30s |
How much most LP’s retain of their traded spread after 30 seconds for similar trades. How sustainable is your flow with your liquidity providers? EBS Average MTM at t0 minus average MI at 30 sec based on your traded Currencies and Volume blend with each LP. |
| Large Trade % |
Shows you, at a glance, the rough distribution of your Parent orders size for which this LP was involved in a trade. Are you trading more big tickets or less with this LP? The percentage of your Parent orders that were greater than 5 mil USD which resulted in trades with this LP. |
Display View: Volume Bucket
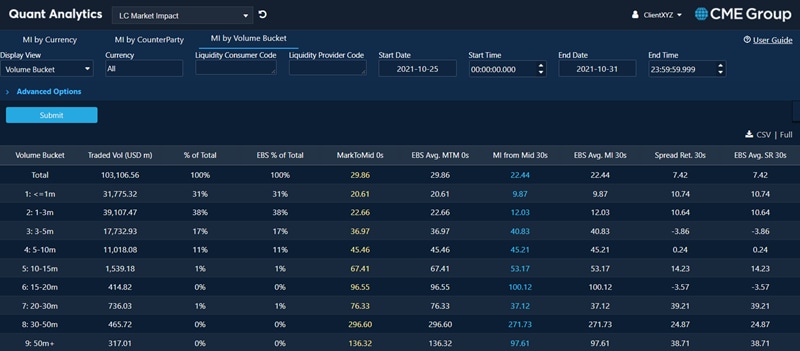
This shows the Market Impact aggregated by LC’s parent order Volumes, and shows the market impact for true volume traded; e.g. if a client bought 20 million in twenty 1 million tickets, this will show as a 20 million trade. The default sort order is by Volume Bucket.
This analysis helps the LC identify and monitor their spreads and market impact by transaction size, generally the larger the trade size (especially on sweep), the larger the impact.
It also allows the LC to compare their trades across volume buckets to the EBS community overall.
| Column | Description |
|---|---|
| Volume Bucket | LC parent order trade size (based on traded volumes). |
| % of Total | The percentage of the Parent orders that were in each bucket. |
| EBS Average Spread retention at 30s |
How much most LPs retain of their traded spread after 30 seconds for similar trades. How sustainable is your flow with your liquidity providers? EBS Average MTM at t0 minus average MI at 30 secs based on your traded Currencies and Volume blend with each LP. |
| EBS % of Total | The percentage of Parent orders that were in each bucket across the whole community; in the case above it doesn’t equal 100%, this tells the client that 11% of trades were in larger bucket sizes (which the LC did not trade in). |
Additional Display Views
| Display View | Description |
|---|---|
| Day | Shows the Market Impact aggregated by days traded. Currently our system works on a GMT 24 hr day. |
| Week | Shows the Market Impact aggregated by weeks traded. The start date for the week is always the Sunday before the start date, so will have slightly different numbers. |
| Hourly | Shows the Market Impact aggregated by hour of the day GMT Time. Currently our system works on a GMT 24 hr day; will move to a NY business day in the future. |
| Trader |
Shows the Market Impact aggregated by trader of the LC. • You can also specify a single or multiple trader in the individual Trader Input box at the top. Once entered, you can run any of the individual display views on any individual trader or group of traders. |
| Extended MI Display | Shows the Market Impact per counterparty, across more detailed time periods from 1 second, 3 seconds, 5 seconds etc. We also have an average market impact for every second up to 60, 300 and 600 seconds. |
| Extended Currency View | Shows the Market Impact per currency, broken down across more detailed time periods from 1 second, 3 seconds, 5 seconds etc. We also have an average market impact for every second 60, 300 and 600 seconds. |


