User Help System
LC Historical Spreads
This dashboard is focused solely on LC (Liquidity Consumer clients) analysis of the price streams they received on EBS Direct (EBSD) and EBS Select (EBSS).
Clients can track up to one year of records for their individual LP’s or a group of LP’s actual quoted price spreads. Please note data starts from January 2019 and will build up. Clients can see each LP’s average quoted price down to an hour by hour level, daily averages, or broken down as an average for hour for the 24 hour trading day.
Clients can plot all spreads received, including TOB through to 50mil plus full amount tiers.
If any quoted spread is greater than 3 times the average spread for the date range, it is removed from calculations. Shown LPs are not determined by actual LP / LC price tier mappings but instead are shown based on trading activity between LC and specific LP price tier. If there has being no trades we continue to show the LP price tier spreads for up to 14 days after the last trade
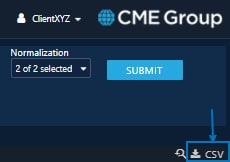
All information can be exported to csv as well.
Default View
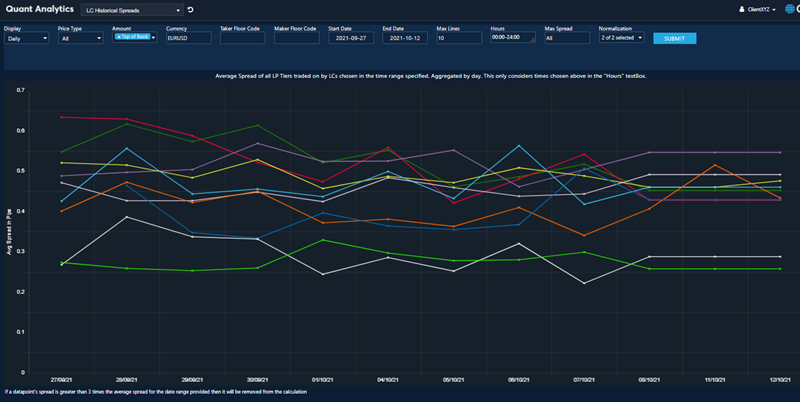
Command List – LC Historical Charts

Display
Click the Display button to quickly navigate to different views
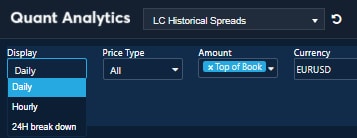
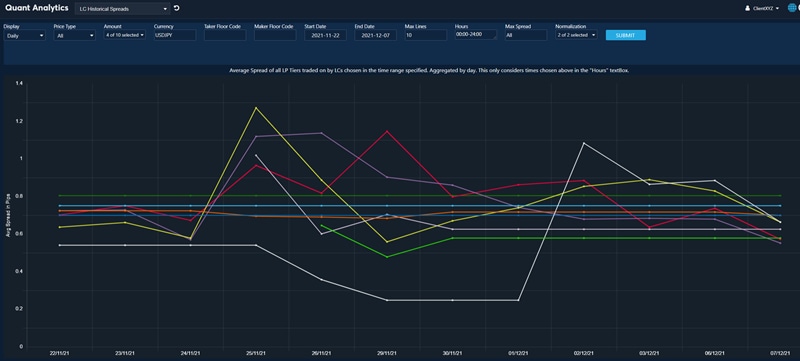
- Daily – charts each LP’s daily average quoted spread per currency.
- Hourly - charts each LP’s hourly average quoted spread per currency.
- 24H break down - charts each LP’s hourly average quoted spread per currency broken down over a 24 hour GMT trading day average over the time period chosen.
Price Type
Clients can choose to plot
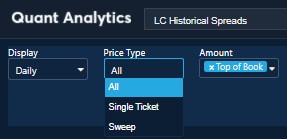
- All - aggregated, streams with the highest volume, independent of whether Single Ticket or sweep stream. This is the default.
- Single Ticket
- Sweep
Amount
Client can choose to see any LP’s quote stream from TOB to 50mil, clients can plot any or all fields, default is Top of the Book
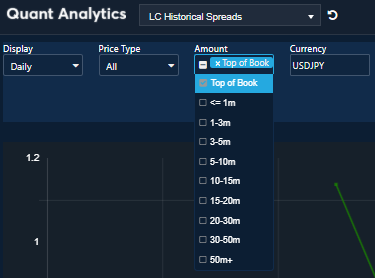
For example here a single client has selected a single LP and can see their TOP USDJPY, 3m, 5m and 10 mil average spreads quoted through time.
Currency
Clients can choose to plot any currency which they have traded, and they will not see any spreads for which they have not traded.
Max Lines
Default is to plot up to 10 LP quotes, it will show the lowest 10 prices for the currency, amount and date range selected.
Hours
Default is to ignore data late in GMT trading day, but users can change to any hour range, eg 00:00-24:00 in hour (minute format HH:MM).
Max Spread
Clients can put a max rate on the quoted spread to cut off tails or wide prices outside of normal trading hours.
Print Table Data
Click the CSV button to export a chart to a data table.
Zoom Feature
Click the chart and hold the left mouse down to zoom in over any period, and press the magnifying glass on the right hand side to zoom back out. This can be useful when in hourly mode.


