User Help System
LC Historical Charts
This dashboard is focused solely on LC (Liquidity Consumer clients) analysis of their trades on EBS Direct (EBSD) and EBS Select (EBSS).
Clients can track up to one years records of their performance with individual LP’s or a group of LP’s. Clients can see each LP’s Volume Percentage share of trading wallet, LP’s traded volume history in USD, LP’s Reject percentage of matched orders, and LP’s average hold times.
This data is available as daily running 5 day average percentage plot, or a hourly running 5 day average of hourly percentage share or as a breakdown of % share of LC trading wallet over 24 hours.
All information can be exported to csv as well.
Default View
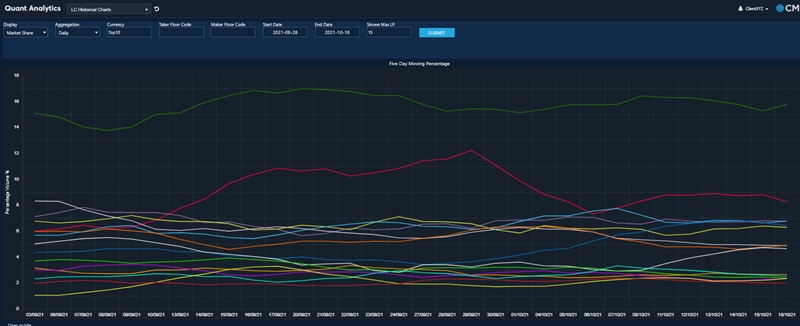
Command List – LC Historical Charts

Display
Click the Display button to quickly navigate to different views
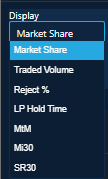
- Market Share – charts each LP’s share of the clients total wallet
- Traded Volume -charts each LP’s traded USD volume
- Reject % - charts each LP’s reject % of matched orders
- LP Hold time- charts each LP’s average hold times on orders matched
Aggregation
Click the Aggregation drop-down to choose different aggregated views.
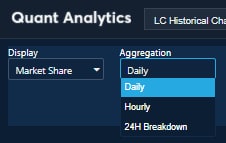
- Daily – plots a daily running 5 day average of the display metric.
- Hourly -plots a hourly average of the displayed metric
- 24 Hour Breakdown – plots an hourly average based on 24 hour GMT time for the displayed metric over the time horizon chosen.
Print Table data
Click the CSV button to export a chart to a data table.
Zoom Feature
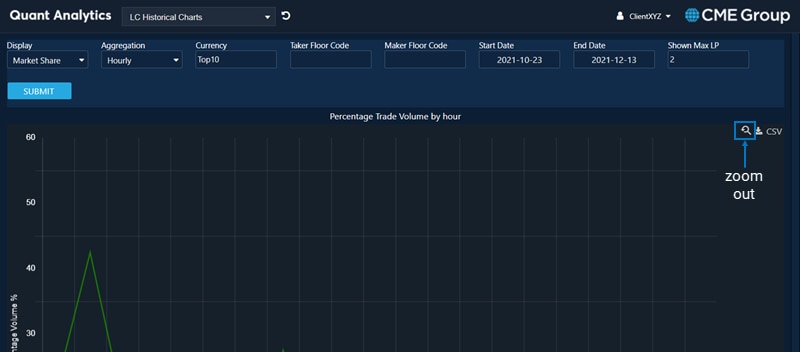
Click the chart and hold the left mouse down to zoom in over any period, and press the magnifying glass on the right hand side to zoom back out.
Hourly Plot volume of top 2 LPs
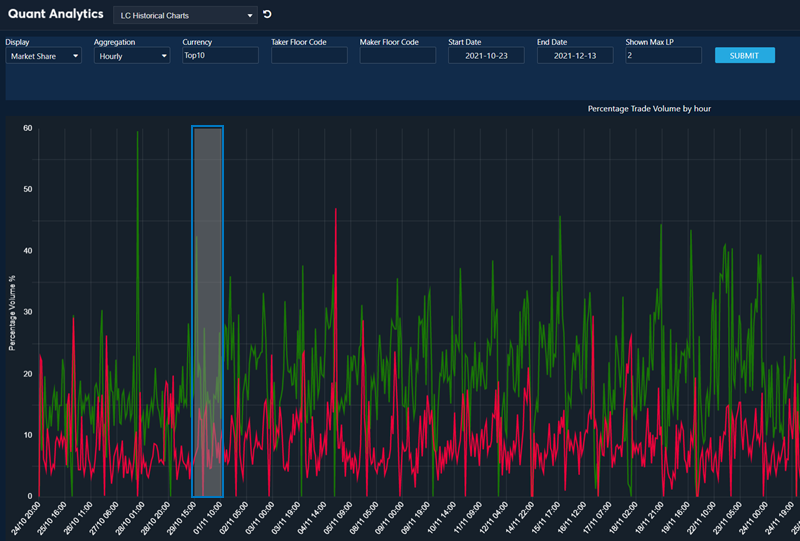
Zooming in to 2 day range
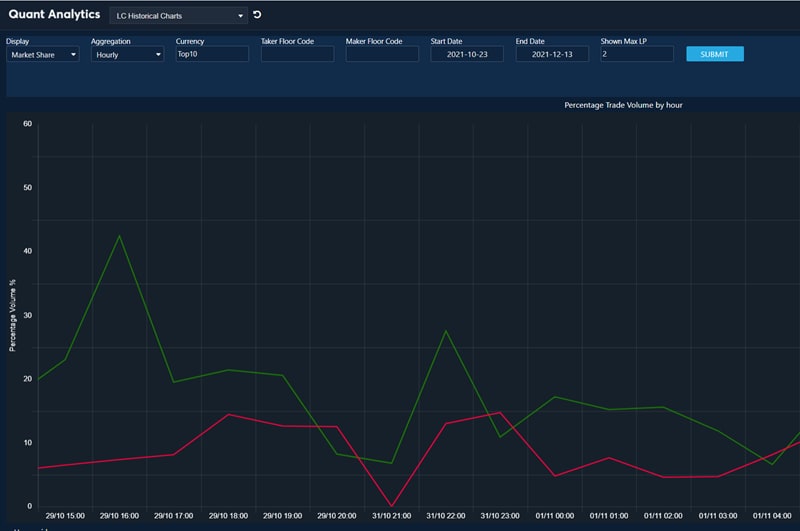
Zoom out to return to chart
