User Help System
Portfolio Margin Details Report
The Portfolio Margin Details Report provides a comparison of the costs saved or incurred between margining the IRS trades and/or Delta Ladder curves and Futures and Options portfolios separately, and margining the IRS portfolio and/or Delta Ladder and Futures and Options portfolios together.
The Portfolio Margin Details Report may be generated for the following portfolio types:
- IRS Trades & Futures (SEQ) Portfolio Margin Details
- DL & Futures (SEQ) Portfolio Margin Details
- IRS Trades & DL & Futures (SEQ) Portfolio Margin Details
When the Cross Margin option in the Futures and Options grid is checked, the trade will be margined against the IRS trades and/ or Delta Ladder and HVAR is used to calculate results. Margins for unchecked Futures and Options are calculated using CME SPAN.
Margin Amounts without Portfolio Margining
|
Margin Amounts without Portfolio Margining |
= |
Interest Rate Swap AND / OR Delta Ladder |
+ (plus) |
Portfolio Margin Futures (FUT) |
+ |
IR Futures and Options (OPT) |
Note: The Portfolio Margin Futures do NOT have the Cross Margin box checked. The Margin Type field will fill with FUT when the portfolio is saved. Interest Rate Futures and Options are cross-margined with the Interest Rate Swaps, and the Cross Margin box is checked. When the portfolio is saved, the Margin Type field will show OPT.
Margin Amounts with Portfolio Margining (Cross-margining)
|
Margin Amounts with Portfolio Margining |
= |
Reduce the total margin payment required by transferring excess margin from one account to another. |
+ |
Interest Rate Futures and Options not cross-margined with Interest Rate Swaps. |
Savings
|
Savings |
= |
Margin Amounts without Portfolio Margining |
- |
Margin Amounts with Portfolio Margining |
Portfolio Margin Results Breakdown
Portfolio Margining in CME CORE approaches initial margin calculation from a total cost savings perspective.

Example: OTC IRS - The comparison is the same for Delta Ladder or IRS and Delta Ladder.
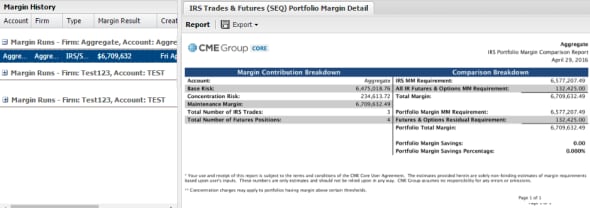
Portfolio Margin Results Comparison Breakdown
- The first set of totals represents the margins for OTC IRS and/or Delta Ladder, Portfolio Margin Futures and Futures and Options initial margin calculated as separate portfolios.
- The second set of totals represents the calculated margin with the OTC IRS and/or Delta Ladder and Portfolio Margin Futures calculated together, and the Residual Futures and Options calculated separately.
- The Portfolio Margin Savings is the savings achieved between the two calculations.
Portfolio Margin Details Report
The Portfolio Margin Details report is a Profit and Loss Vector Histogram.

Example: OTC IRS - The report is the same for Delta Ladder or IRS and Delta Ladder.


