WTI Insights by PVM
There is a myriad of factors that play a salient role in the formation of oil prices. The ultimate price driver, nonetheless, is the global oil balance. It is a generally accepted fact that excess supply and rising worldwide and regional oil inventories put downward pressure on prices. In case demand outstrips supply, the opposite is true: stocks deplete, and prices strengthen.
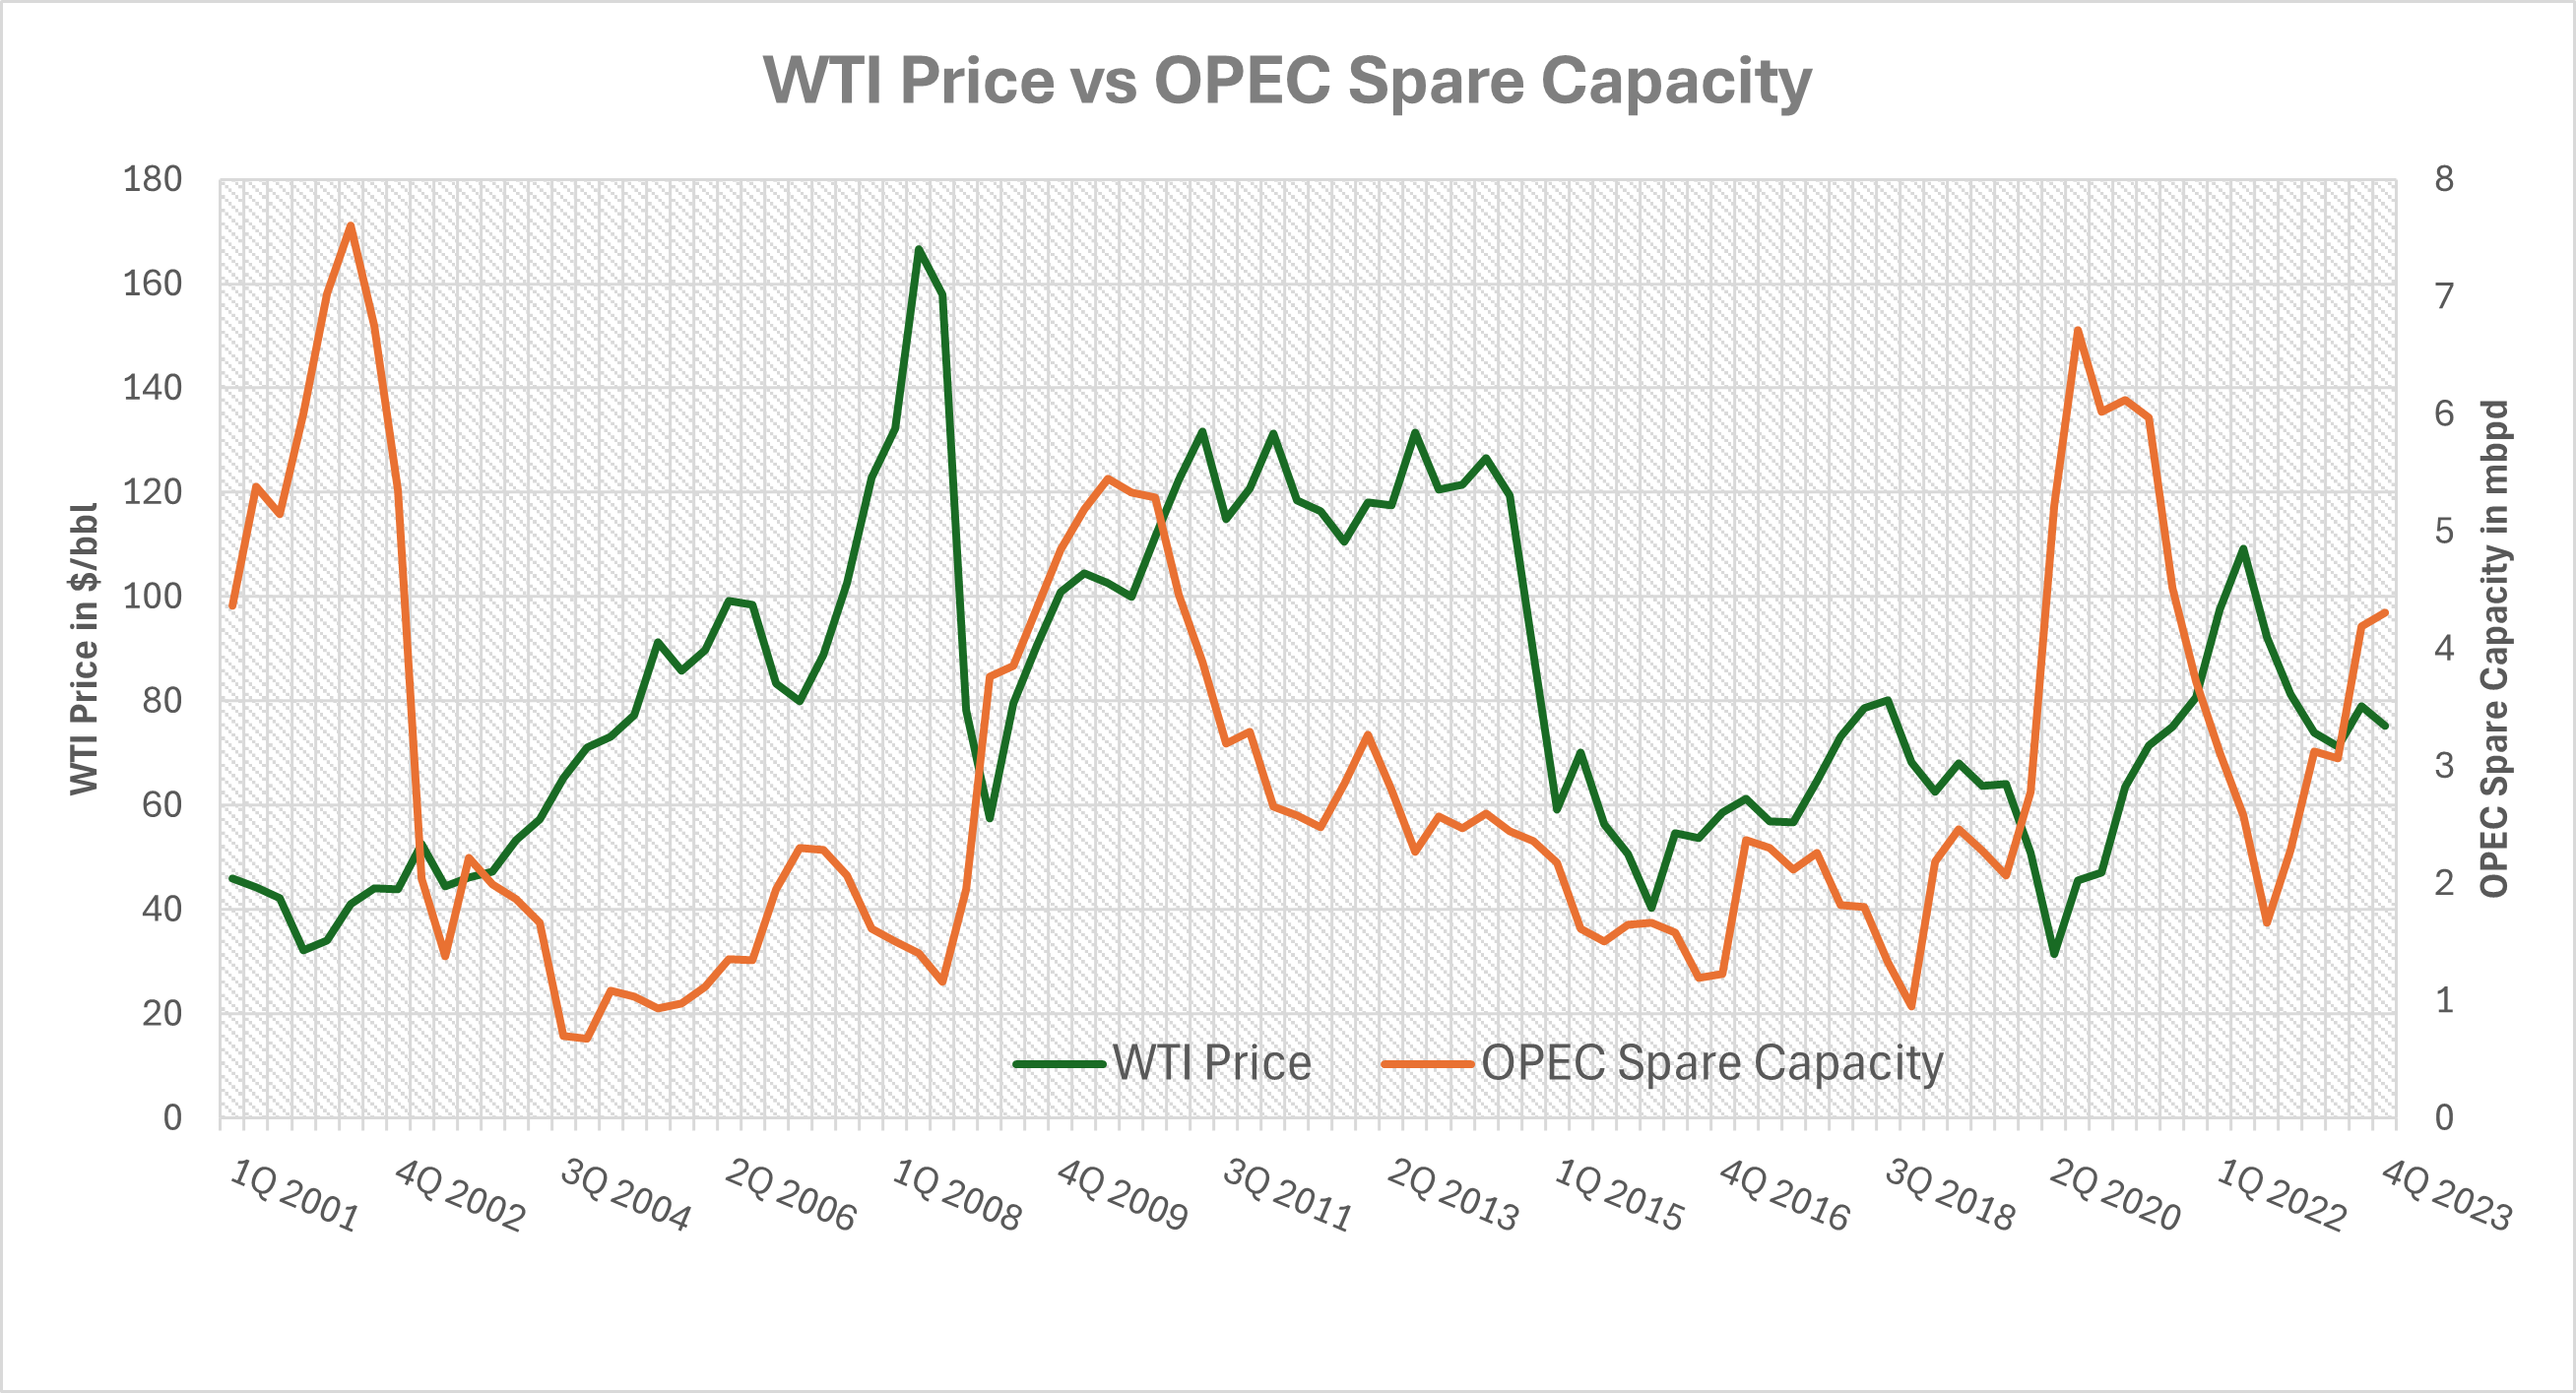
This simple approach, however, is more nuanced. Investors pay closer attention to the “perceived” as opposed to the “actual” oil balance. In other words, they take into consideration the spare capacity that can be utilized in case of material supply shortage. This approach is aptly summed up in the chart above. OPEC, the swing producer of the oil market, is the predominant group whose self-declared role is to balance the market. Whilest the inverse relationship between its spare capacity, as estimated by the EIA and the GDP-deflated price of WTI is not always conspicuous (after all there are other factors to be considered at times) it is obvious that abundant spare capacity limits price upside and vice versa.
At the beginning of the bull run in the early 2000s more than 7 mbpd of available extra OPEC oil ensured that prices struggled to make significant headways. Then, the spectacular rise of the Chinese economy snapped up these barrels, and as the supply cushion narrowed to 1 mbpd six years later, the real price of the U.S. benchmark jumped considerably above $150/bbl. The 2012-2014 period saw oil prices reliably staying over $100/bbl with OPEC’s spare capacity under 3 mbpd.
To translate this phenomenon to the oil balance of the present day, it must be noted that OPEC’s attempt to support the market by setting output ceilings for member states has entailed a significant build-up in spare capacity, which has been on the ascent for the past two years. Whilest the producer alliance has successfully supported oil prices for over a year, the widening supply cushion will almost guarantee that the upside remains limited – unless Persian Gulf producers are drawn into the Middle East conflict and their production is adversely impacted.
Stay in the know
Keep up with the crude oil markets. Get biweekly analysis from PVM, the leading oil instrument broker – courtesy of CME Group.
Already have an account? Log in
By clicking above, you are subscribing and agreeing to receive the specified content. I understand that I can unsubscribe at any time.
This site is protected by reCAPTCHA and the Google Privacy Policy and Terms of Service apply.
All examples in this report are hypothetical interpretations of situations and are used for explanation purposes only. The views in this report reflect solely those of the author and not necessarily those of CME Group or its affiliated institutions. This report and the information herein should not be considered investment advice or the results of actual market experience.

