
- 3 Oct 2018
- By CME Group
The Fed’s Federal Open Market Committee (FOMC) meetings tend to be significant market events, characterized by high levels of trading activity driven by their decision on U.S. interest rates and commentary on the health of the U.S. economy. This elevated trading activity is evidenced intraday, particularly in the nanosecond level order book data. Some market participants believe that this heightened activity and volatility has a negative impact on market liquidity. To examine this assumption, we analyze intraday data on the benchmark 10-Year T-Note futures (ZN) on the January 31st FOMC meeting.
At 13:00 CST, the FOMC announced its decision to leave the U.S. Fed Funds rate unchanged. While this decision was widely expected by the market, trading activity in the active ZN contract, analyzed across multiple dimensions, clearly show large upticks in volume and price volatility around the FOMC event. However, the data also shows that liquidity–in the form of average top-of-book order sizes and quantities and cost-to-trade (in ticks)–is well-maintained throughout the event. This conclusion challenges the assumption that top-of-book market depth dries up during turbulent periods. Rather, it shows that on a volatility and volume-adjusted basis, even in the presence of FOMC event risk, ZN exhibited abundant liquidity, particularly when considering “hidden liquidity”. Hidden liquidity represents not only the quantity available on the order book, but also the rate of replenishment of the order book based on the amount of actual transactions.
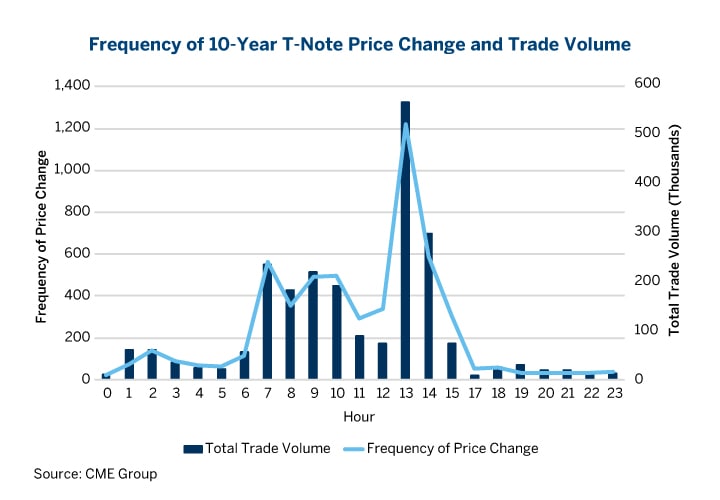
Both ZN electronic volume and the number of times the traded price changed (a proxy for price volatility) peaked at 13:00 CST when the FOMC announcement was made. These metrics are compiled from transaction-level trades.
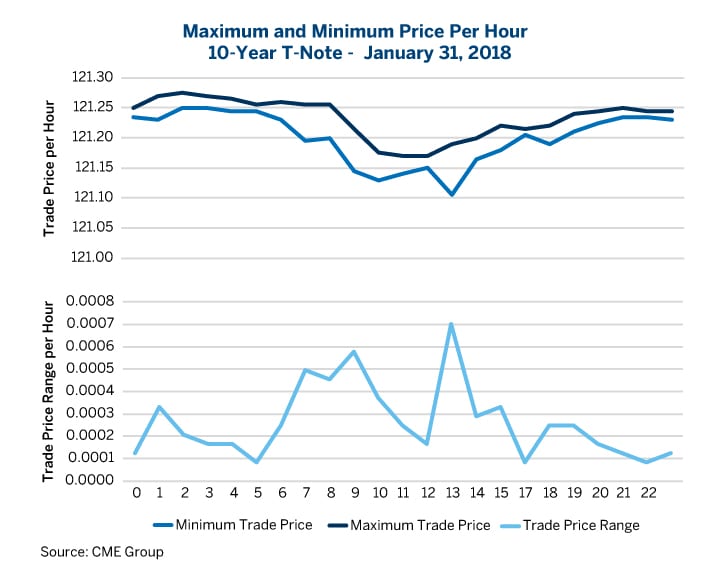
Furthermore, the high-low ZN price swings (an additional proxy for volatility) were widest within the hour of the meeting, 13:00 CST.
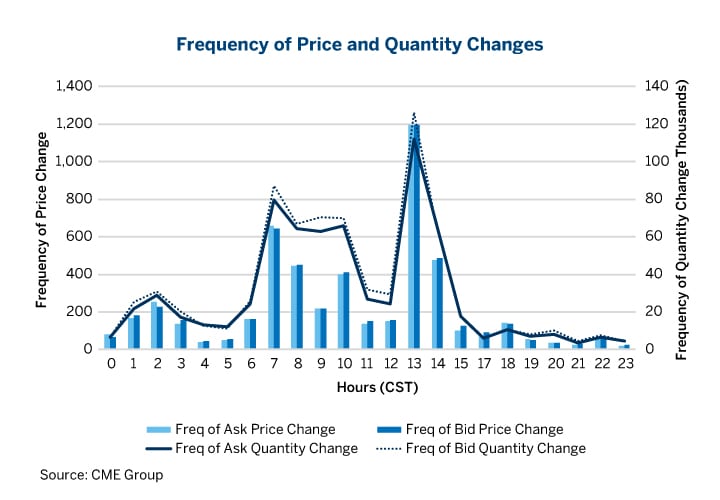
Not only did transaction activity and price volatility peak during the hour of the meeting, but so did the frequency of displayed ZN order book changes. This represents trader sentiment but is not necessarily tied directly to transactions. Both Ask and Bid order book quantities and prices updated rapidly in response to the FOMC announcement. This represents activity whenever new orders are placed, orders are cancelled, or liquidity is taken off in the form of a transaction, capturing trader behavior beyond executed trades and volume.
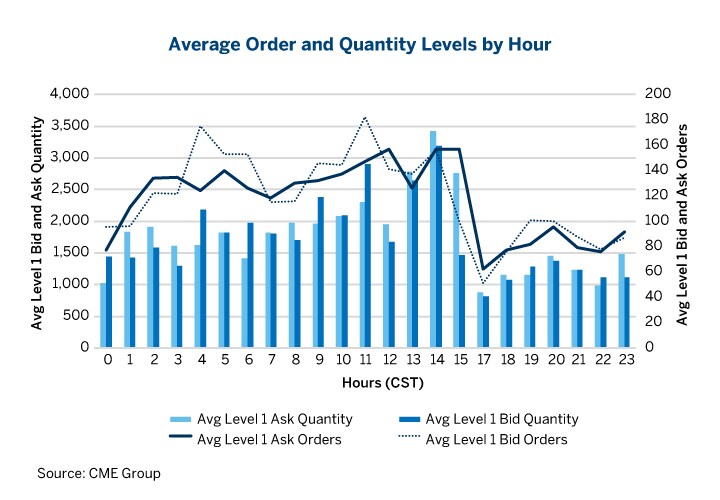
Even as other measures of volatility peaked at the time of the FOMC announcement, the chart below shows that the market depth, represented by bid and ask orders and quantities, remained high throughout the trading day and the FOMC announcement.
To summarize, in the presence of a market moving event, we observe intraday record trade volumes, price volatility, and displayed order activity. Some may assume that this suggests deteriorating liquidity in terms of trade quantities posted. However, the evidence shows that liquidity is sustained at non-event levels even when the event takes place; the top-of-book posted healthy and sustained quantities throughout the day, in terms of both order quantities and number of orders.
In addition to the stable liquidity observed through the intraday volatility seen on January 31,, the market retained low implementation costs ahead of and immediately after the FOMC announcement. This allowed participants to enter or liquidate positions with an average of 1-tick level implementation costs at a variety of lot sizes. Additionally, the 5 lot buy and sell implementation cost shows an average 1 tick at all hours of the day.
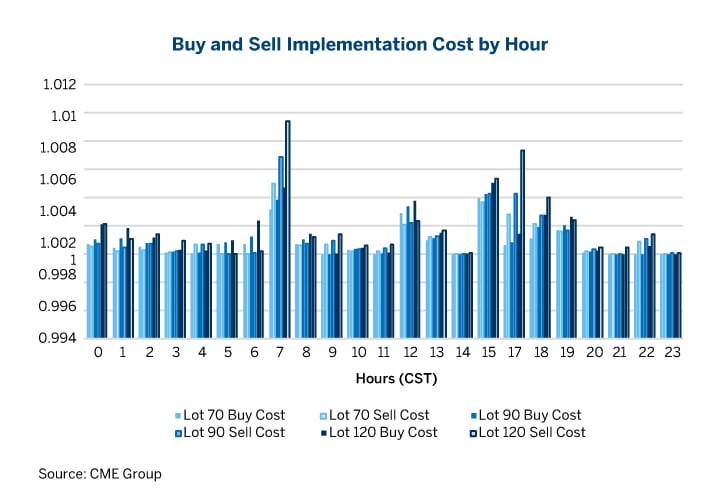
This multi-dimensional analysis on ZN liquidity in the face of high event-driven volatility and volume demonstrate the sustained health of CME’s order book throughout the day. On a volume and volatility adjusted basis, liquidity was abundant during and through the FOMC event.
This data challenges the common misconception that order book depth can “dry up” during periods of high market stress, either in the form of elevated price volatility or transaction volume. The insights derived here can help participants to refine their trading strategies to prepare for market events.
Try the CME Liquidity Tool
Analyze bid-ask spreads, book depth and cost to trade statistics for CME Group products.
More Liquidity Insights
Read insights on market movements based on analysis from the CME Liquidity Tool data. Dive into how macroeconomic events affect liquidity in CME Group futures markets.
About CME Group
As the world’s leading derivatives marketplace, CME Group is where the world comes to manage risk. Comprised of four exchanges - CME, CBOT, NYMEX and COMEX - we offer the widest range of global benchmark products across all major asset classes, helping businesses everywhere mitigate the myriad of risks they face in today's uncertain global economy.
Follow us for global economic and financial news.