Timera Energy Chart of the Month
March 2025 highlights
- Record-High U.S. gas production amid stronger prices: HH Front-months rebounded above $4.00/MMBtu by early-2025, driving dry-gas production to a record high of 106 Bcf/d. Marking a significant recovery following a year of subdued output caused by low prices.
- Increasing demand steering attention to US production: With LNG exports and domestic consumption increasing, continued U.S. natural gas production growth will be critical to preventing price surge.
February U.S. natural gas production rising with higher prices
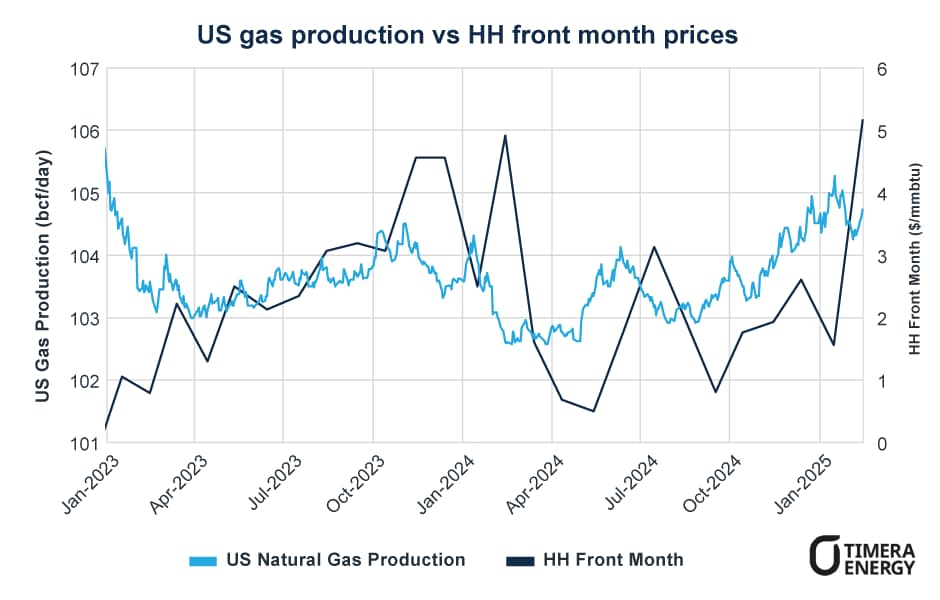
U.S. dry gas production has climbed up to all-time highs as of mid February, following a sustained period of stronger Henry Hub prices. According to EIA data, dry gas production averaged ~106 bcf/day in February, up 3.5% from Jan. when freeze-offs drove weaker output.
Increasing U.S. supply comes as a result of HH front-month prices surging from an average of $2.38/mmbtu in September to $3.77/mmbtu in January, a rise driven primarily by:
- Cold winter weather spurring higher domestic heating demand
- Record LNG feedgas demand.
The responsiveness of supply to price level is a key source of flexibility in balancing the U.S. gas market. U.S. production fell notably in Q2 2024 following a historically low-priced period, where HH front-month futures dropped to $1.58/mmbtu. This drove gas production curtailments from large shale players, and overall U.S. dry gas production struggled to sustain levels above 103 bcf/day for most of 2024 despite a power sector-driven demand surge across the summer.
Continued growth in U.S. natural gas production will be crucial to preventing a sharp rise in domestic prices over the next 2 – 3 years. Feed gas demand is expected to increase significantly as new LNG capacity comes online, rising by 2–3 Bcf/d in 2025 and potentially exceeding 10 Bcf/d by 2028. At the same time, domestic consumption is set to grow, fuelled by the expansion of gas-fired power generation, re-shoring of energy-intensive industries, and the rising energy needs of data centers.
As these shifts drive greater demand and price volatility, Henry Hub trading volumes have surged, reflecting increased hedging activity from LNG exporters and other market participants. February saw a record average daily volume (ADV) of 1,125,027 combined contracts, while open interest neared 8 million contracts. With LNG exports expanding, futures and options remain a key tool for managing price risk amid shifting supply and demand dynamics.
Attention therefore turns towards domestic supply response, with key issues to monitor including producer investment appetite, shale basin break evens and any infrastructure bottlenecks that require lead times to solve.
timera-energy.com
+44 (0) 207 965 4541
info@timera-energy.com
The contents of this document is for informational purposes only, should not be considered as investment or trading advice, and is not an offer to sell or a solicitation to buy any futures contract, option, security, or derivative including foreign exchange.
© Timera Energy 2025 | Registered in England and Wales No 6728502
Stay in the know
Get monthly analysis of natural gas trends and events from Timera, a leading industry consultant – courtesy of CME Group.
Already have an account? Log in
By clicking above, you are subscribing and agreeing to receive the specified content. I understand that I can unsubscribe at any time.
This site is protected by reCAPTCHA and the Google Privacy Policy and Terms of Service apply.
The opinions and statements contained in the commentary on this page do not constitute an offer or a solicitation, or a recommendation to implement or liquidate an investment or to carry out any other transaction. It should not be used as a basis for any investment decision or other decision. Any investment decision should be based on appropriate professional advice specific to your needs. This content has been produced by Timera Energy. CME Group has not had any input into the content and neither CME Group nor its affiliates shall be responsible or liable for the same.
CME GROUP DOES NOT REPRESENT THAT ANY MATERIAL OR INFORMATION CONTAINED HEREIN IS APPROPRIATE FOR USE OR PERMITTED IN ANY JURISDICTION OR COUNTRY WHERE SUCH USE OR DISTRIBUTION WOULD BE CONTRARY TO ANY APPLICABLE LAW OR REGULATION.