- 28 Aug 2018
- By Blu Putnam and Natalie Denby
- Topics: Economic Events
The Federal Reserve (Fed) is well into the process of shrinking its balance sheet, bloated by years of quantitative easing, by allowing a modest run-off of maturing Treasury and Mortgage-Backed Securities. The Fed is taking a go-slow approach and most analysts expect it will take quite a few more years for the balance sheet to shrink to a modestly smaller and sustainable size. What is not yet clear is the end-game – that is, the desired and sustainable size of the balance sheet as a percentage of nominal GDP. Like many analysts, we initially focused on the asset side of the balance sheet and the relative ease with which assets can be shrunk, simply by not replacing maturing Treasury and Mortgage-Backed Securities. We, therefore, expected the path would be smooth and it was just a matter of deciding how big the Fed’s balance sheet should be in the long term. On further examination, however, we refocused on the liability side of the balance sheet, and we now see the growth of Fed liabilities as the key constraining element in determining when the Fed halts the balance sheet shrinking process. Indeed, if liability-side growth constrains the shrinkage process, then the Fed’s period of reduced demand for Treasury securities may be surprisingly short-lived. As explained below, the reasons may well be a surprise.
The Fed provides several important services to the U.S. financial system and economy that show up on the liability side of the balance sheet. An appreciation of these services, the liabilities they create, and how fast they are growing are all critical factors in understanding why Fed liability management may be even more important than asset management. Let’s go through the list.
Figure 1: Federal Reserve Liabilities.

The largest single category of Fed liabilities is deposits held by commercial banks at the Fed, representing about 45% of the Fed’s liabilities. Prior to the 2008 financial panic, most of these bank reserve holdings were required by the Fed’s regulations relating to bank safety and security. Since 2008, the majority of these deposits have been excess reserves above and beyond required reserves. As of 15 August 2018, there were $1.9 trillion in bank reserves, of which about $1.8 trillion were excess reserves.
Unlike the other categories of Fed liabilities, discussed below, bank reserves can be shrunk by the Fed. As the Fed decreases its asset holdings, it effectively drains reserves from the system, reducing excess reserves. The Fed has an incentive to make this happen, given that since end-2008, the Fed has paid interest on reserve holdings. As the yield curve flattens with each hike in the federal funds rate target range, the rate the Fed pays as interest also increases, approaching the interest yield on the Treasury securities in the Fed’s portfolio. Flat yield curves not only affect the economy, they also have a negative impact on Fed earnings.
The trillions of dollars of excess reserves complicate the Fed’s ability to influence the federal funds rate and keep it inside the desired target range. Prior to 2008, the Fed could conduct repurchase activities to drain or add reserves to the system and push the federal funds rate toward its desired target. Since 2008, with trillions of excess reserves in the system, the Fed has used the rate of interest it pays on reserves as its primary means of controlling the federal funds rate. As a result, when the Fed raises its target range, it also raises the rate it pays on reserves, which are federal funds. Shrinking the amount of excess reserves will make it easier for the Fed to influence (if not control) the federal funds rate through open market operations instead of making interest payments on reserves.
Our base case scenario for end-2022 is that the Fed will try to reduce excess reserves to about half of required reserves. We have estimated that required reserves will rise to around $200 billion as the economy grows, and that through asset shrinkage the Fed can decrease excess reserves to as little as $100 billion, although a higher target may gain sway among members of the Federal Open Market Committee (FOMC).
The Fed serves as the banker to the U.S. Treasury. Deposits by the U.S. Treasury at the Fed averaged $225 billion in 2017 and 2018, but they are quite volatile and have run as high as $429 billion. Given the likelihood of ever-expanding expenditures in the federal budget, the Fed needs to plan on U.S. Treasury deposits (liabilities of the Fed) potentially reaching $400-500 billion on any given week over the next few years.
The Fed participates in agreements with other central banks and typically has repurchase agreements, which totaled $246 billion on the week of 15 August 2018. These liabilities to foreign central banks and international agencies are relatively stable; however, they can move during times of exchange rate management activities. The Fed will need to plan to accommodate around $300 billion or more of these liabilities over the next few years and will require a contingency plan if there is a burst of exchange rate volatility.
As part of the Dodd-Frank legislation passed after the financial panic of 2008, the Fed began accepting deposits from a variety of entities, including those designated as systemically important financial institutions (SIFI) that are not required to hold reserves at the Fed. These deposits now total some $75 billion, and they are likely to grow to $100 billion over the next few years.
The Fed also has its own capital account. Typically, the Fed pays out most of its net earnings to the U.S. Treasury every year -- $80-$100 billion since the massive quantitative easing programs created a huge portfolio earning interest for the Fed. The Fed’s capital account on the liability side of the balance sheet may remain around $50 billion or just creep a little higher.
All told, today there are about $710 billion in liabilities associated with non-banks, such as the U.S. Treasury, foreign central banks, international agencies, and non-bank financial entities in the U.S. allowed to hold deposits at the Fed, as well as the Fed’s own capital account. By end-2022, today’s $710 billion may have grown to $900 billion. This growth is largely outside the control of the Fed since it provides banking services on demand for these non-bank institutions. When these liabilities increase, the Fed invests the money in its asset portfolio. Banking services to non-banks are a part of the Fed’s balance sheet it does not control, and its incremental growth will limit the reduction of the balance sheet. However, the roughly $200 billion estimated increase over the next few years is small potatoes compared to our last category – currency in circulation.
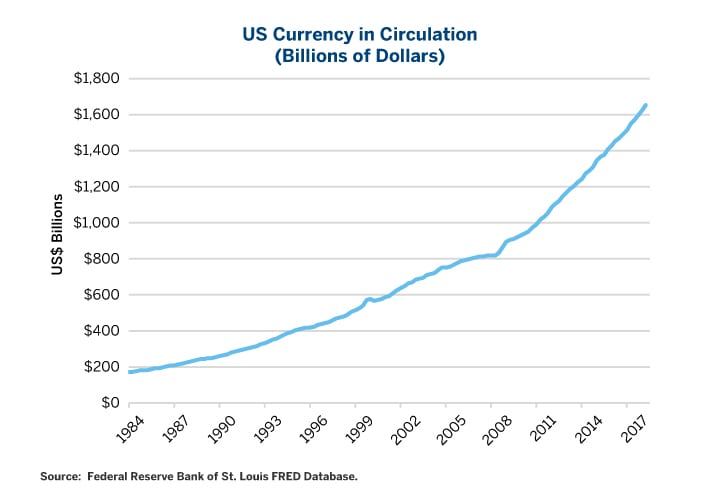
U.S. currency declares in large letters across the front of every bill that it is a “Federal Reserve Note,” or a liability of the Fed. U.S. currency is printed by the U.S. Treasury’s Bureau of Engraving and Printing, and the freshly minted currency is distributed by the Fed through the commercial banking system. As of the 15 August 2018, the Fed reported the size of its balance sheet at $4.3 trillion, of which currency in circulation was $1.67 trillion, or just under 40% of total Fed liabilities. The interest expense for the Fed on its currency liabilities is zero, making currency an appealing funding source for the asset side of the balance sheet.
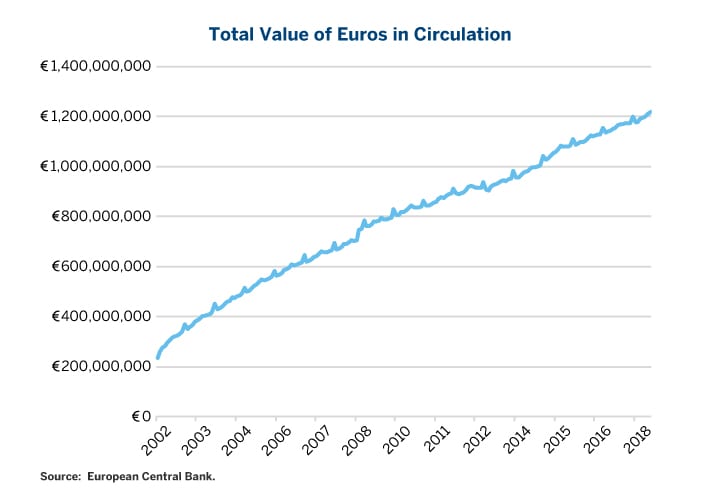
What is especially interesting about currency in circulation is how rapidly it is growing, even in the Internet Age of paying bills with smart phones, credit cards, etc. One might have thought that the demand for cash would be declining with the rise of digital means of payment, and one would have been quite wrong. We note that, as shown in Figure 3, the European Central Bank (ECB) is seeing rapid growth in the Euro currency in circulation, just like the U.S. Fed, so this is not just a U.S. phenomenon.
Figure 2: US Currency in Demand Despite the Age of Digital Payment Methods.

Figure 3: Euro Bills Outstanding.

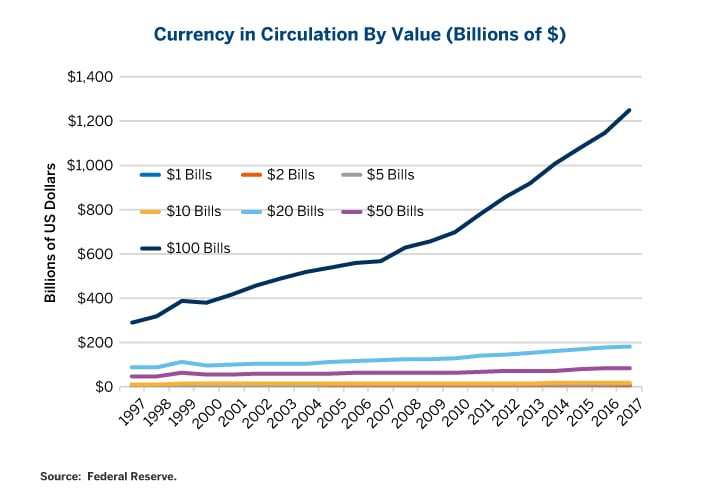
There are some interesting observations that help explain the growth of currency in the age of digital payment methods. First, approximately 60% or more of U.S. currency is outside the United States, according to estimates from Fed economist Ruth Judson, a Treasury Department report, and the Fed itself. Second, the denomination that dominates the growth in demand for currency is far and away the $100 bill. (See Figure 4.) By the way, the U.S. once had $1,000, $5,000, and $10,000 bills available. They were last printed in 1945; however, the Fed did not stop distributing them until 14 July 1969, and they are still technically legal tender although possibly worth more as a collector’s item than their face value.
Figure 4: Value of Bills by Denomination.

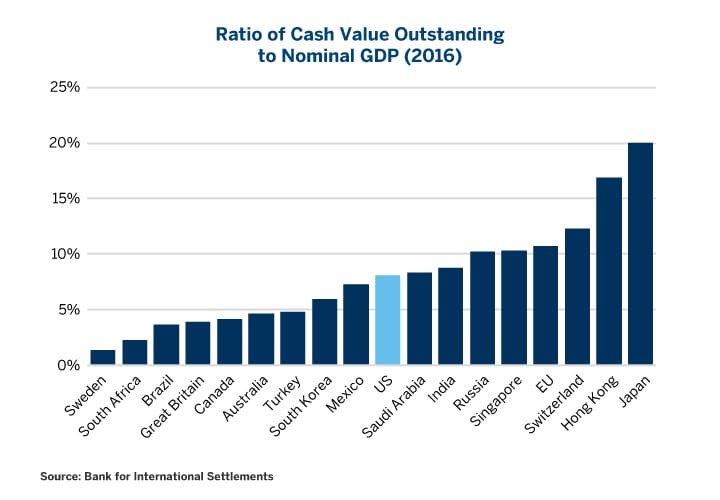
While there are some countries that use small denomination U.S. currency for transactions, such as Ecuador, the general presumption is that the preponderance of US$100 bills offshore represents demand driven by tax avoidance and black-market activities. The importance of cash in the shadow economy is widely known (see, for instance, Tom Cruise’s American Made). Certain countries, such as Sweden, have made a concerted effort to eliminate cash from their economies. Sweden has reduced currency-outstanding to less than 3%. (See Figure 5.) Other central banks, such as the National Bank of Switzerland and the European Central Bank, have either removed large denomination bills from circulation, or have come under pressure to do so (i.e., CHF 1000 and EUR 500).
Figure 5: International Comparison of Currency Outstanding.

Figure 6. US Currency as a Percent of GDP.

Our point, though, is that if current trends persist, U.S. currency in circulation is going to be the liability item that keeps the Fed from shrinking its balance as much as it might like. In terms of a percentage of GDP, U.S. currency outstanding is just over 8%, and it might grow to 9% or 10% of GDP by 2022. This would be $2.3-2.6 trillion of liabilities sitting on the Fed’s balance sheet. Fed liabilities from currency outstanding clearly represent a growing and major constraint on shrinking the balance sheet. The key decision to reverse this trend would be for the U.S. Treasury to stop printing new $100 bills, and we do not see this as a likely policy shift.
So, let’s cut to the chase. The Fed’s balance sheet peaked at $4.5 trillion and has shrunk gradually to $4.3 trillion as of August 2018. By end-2022, we are projecting that the Fed’s balance sheet will have shrunk only to $3.7 trillion – much less than estimates by many other analysts who are focused on the asset side of the balance sheet. As we have argued, the constraints are on the liability side. The Fed provides on-demand banking services, meaning accepting deposits, which are liabilities of the Fed, and these are likely to grow by some $200 billion over the next few years. But the big constraint is the growth of currency in circulation. The Fed is an on-demand provider of currency. Today, currency represents about 40% of the Fed’s liabilities. If currency outstanding continues to expand a little faster than GDP, as it has been doing for the last decade, then by end-2022, currency in circulation may represent about two-thirds of the Fed’s liabilities and will prevent further shrinkage of the balance sheet. And, as currency expands on the liability side of the ledger, the Fed can be counted on to invest the money in Treasury securities on the asset side. In short, the Fed’s current reduced demand for Treasury securities may be short-lived if the liability side of the balance sheet has anything to say about it.
Figure 7: Composition of the Fed’s Liabilities for August 2018 and December 2022 (estimated).
| Composition of Federal Reserve Liabilities | |||||||
|---|---|---|---|---|---|---|---|
| Week Ending 15 August 2018 | |||||||
| US$ Millions for Week Ending 15 August 2018 | US$ Millions for Week Ending 15 August 2018 | Percent of Total Liabilities for Week Ending 15 August 2018 | Percent of Total Liabilities for Week Ending 15 August 2018 | US$ Millions for End-2022: CME Economics Estimate | Percent of Liabilities for End-2022: CME Economics Estimate | ||
| Total Federal Reserve Liabilities | $4,303,819 | 100.00% | $3,700,000 | 100.00% | |||
| Liabilities that are NOT Reserve Balances | $2,381,272 | 55.33% | $3,400,000 | 91.89% | |||
| Currency in circulation | $1,670,987 | 38.83% | $2,500,000 | 67.57% | |||
| Foreign official and international accounts Repurchase Agreements and Other Foreign Official Holdings | $246,130 | 5.72% | $300,000 | 8.11% | |||
| U.S. Treasury General Account and Cash Holdings | $343,018 | 7.97% | $450,000 | 12.16% | |||
| Other Non-Bank Deposits | $74,107 | 1.72% | $100,000 | 2.70% | |||
| Capital, other liabilities and other non-official Repurchase Agreements | $47,030 | 1.09% | $50,000 | 1.35% | |||
| Reserve Balances with Federal Reserve Banks | 1,922,547 | 44.67% | $00,000 | 8.11% | |||
| Required Reserves | 125,535 | 2.92% | $200,000 | 5.41% | |||
| Excess Reserves | 1,797,012 | 41.75% | $100,000 | 2.70% | |||
About the Author
Bluford “Blu” Putnam has served as Managing Director and Chief Economist of CME Group since May 2011. With more than 35 years of experience in the financial services industry and concentrations in central banking, investment research, and portfolio management, Blu serves as CME Group’s spokesperson on global economic conditions.
View more reports from Blu Putnam, Managing Director and Chief Economist of CME Group.
Natalie Denby
Natalie Denby is an economics student at the University of Chicago.
Sonia Futures Coming Oct. 1
Sterling Overnight Index Average (SONIA) futures will trade alongside Fed Fund, SOFR and Eurodollar futures, creating new spread trading and margin offset opportunities.