- 24 Sep 2020
- By Erik Norland
- Topics: Economic Events
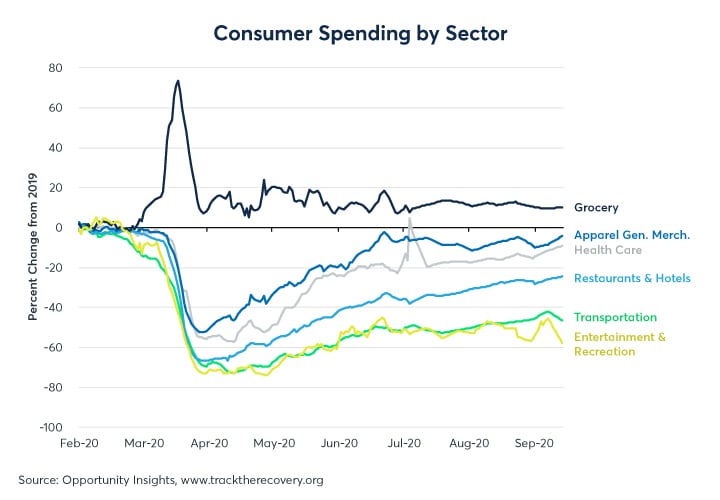
US economic activity recovered at a brisk pace in May and June as the country came out of lockdowns. Over the course of July, August and early September, the pace of improvement, however, slowed and became uneven across economic sectors. With the exception of a brief period of improvement around the Labor Day weekend, U.S. consumer spending has remained about 5% below last year’s levels since Aug. 1 (Figure 1), according to data from www.tracktherecovery.org. Their data shows that spending is still down around 10% in the highest-income zip codes, which could be a reflection of many high earners leaving urban centers to work from other areas of the country. Spending in the lowest-income areas has been running at or above 2019 levels, perhaps reflecting the impact of those moving from urban centers into rural areas.
A breakdown of trends across different economic sectors, shows the following:
- Grocery store sales are still about 10% higher than they were in 2019, a trend that has persisted since early April.
- Apparel and general merchandise sales have generally been about 2-10% lower than in 2019, worsening in June and July but rebounding in August and early September.
- Health care spending has recovered from around 20% below 2019 levels in early July to around 10% as of mid-September.
- Restaurant and hotels have steadily regained customers over the summer as their businesses have gone from being down 40% year on year to being down by about 25%.
- Transportation saw a much slower recovery but did appear to benefit from the summer driving season, which took its revenues from -50% year on year in early July to around -40% over the Labor Day weekend. Since the Labor Day weekend, transportation spending has been retreating towards -50% year on year. Many people are not commuting to work and the summer driving season is over.
- Entertainment and recreation remain the weakest sector, still down around 60% year on year and was the only sector to deteriorate over the summer with the exception of a small Labor Day weekend boost (Figure 2).
Data from other sources largely confirm these trends. OpenTable shows US restaurant reservations were down around 45% year on year, on average, over the past week following a sharp improvement over the Labor Day weekend. The picture in Canada is only slightly better, with restaurant bookings down by around 39% year on year (Figure 3). Both nations saw steady improvement in bookings over the summer, and the data does not include take-away meals and delivery, which have also bolstered restaurant revenues.
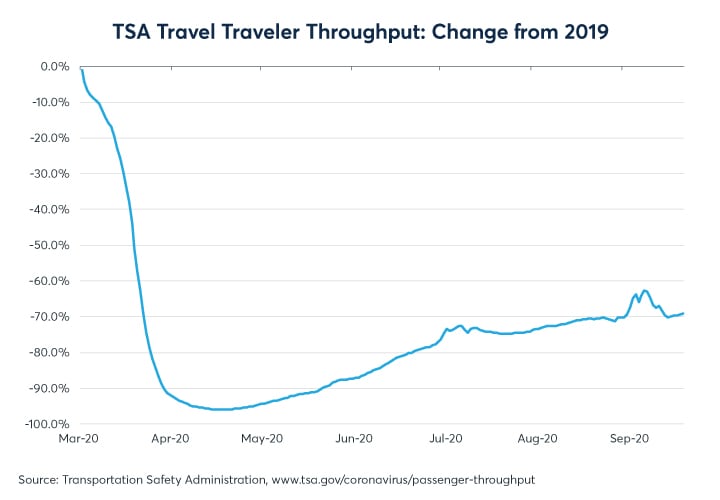
Transportation Security Administration (TSA) checkpoint screenings also confirm Track the Recovery.org’s transportation spending data. The TSA numbers show a slow pace of gains for the airline industry since early July, with the exception of the Labor Day weekend, which featured a bump in the number of leisure travelers (Figure 4). Business travel, the lifeblood of the aviation industry, remains moribund.
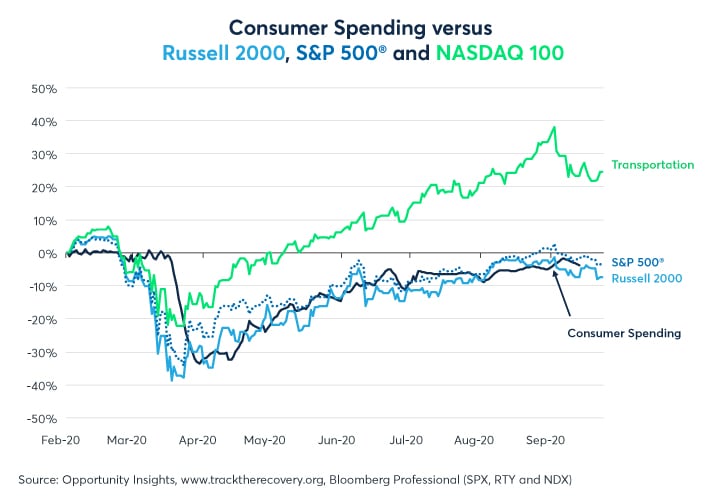
Overall, these alternative data sets paint the picture of a US economy that is doing much better than it was five months ago, but also reflect the struggle to recover more quickly. The combination of a weak economic recovery and a strong stock market has given rise to a narrative that the US equity market has become disconnected from the state of the real economy. In truth, the S&P 500 and the Russell 2000 have tracked the daily US consumer spending data quite closely. Among the major indices, only the technology-heavy Nasdaq 100 has outperformed the broader economy (Figure 5).
With monetary policy having likely done as much as it can for the economy and further fiscal expansion likely delayed until after the November election, the short-term direction of the US economy depends heavily on the course of the pandemic and public responses to it.
All examples in this report are hypothetical interpretations of situations and are used for explanation purposes only. The views in this report reflect solely those of the author(s) and not necessarily those of CME Group or its affiliated institutions. This report and the information herein should not be considered investment advice or the results of actual market experience.
About the Author
Erik Norland is Executive Director and Senior Economist of CME Group. He is responsible for generating economic analysis on global financial markets by identifying emerging trends, evaluating economic factors and forecasting their impact on CME Group and the company’s business strategy, and upon those who trade in its various markets. He is also one of CME Group’s spokespeople on global economic, financial and geopolitical conditions.
View more reports from Erik Norland, Executive Director and Senior Economist of CME Group.
Interest Rate Futures and Options
Use Interest Rate futures and options to manage exposure to government bonds and money market securities in a safe, capital-efficient way.


