Hedging U.S. Equities with Treasury Options
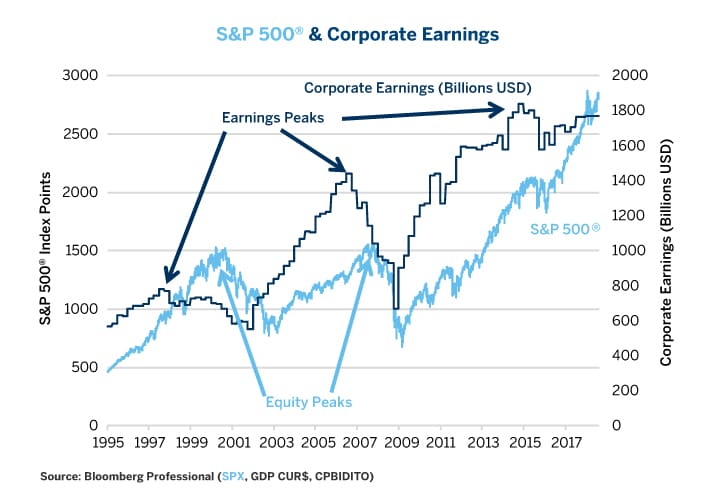
U.S. equities may be in the late stages of a bull market. In their early stages (1991-1996, 2003-2005 and 2009-2014), earnings and equity prices rise in tandem. In the late stages (1997-2000, 2006-2007 and 2015-), earnings stagnate or decline while prices continue to advance anyway (Figure 1). For the moment, earnings remain relatively robust but are not growing any faster than GDP. At some point, with rising interest rates, a tightening labor market and a trade war, earnings may begin to decline outright as they did during the late 1990s and in 2006 and 2007. A decline in earnings does not necessarily imply an immediate decline in stocks but with interest rates rising and the possibility of a recession around 2020, give or take a year, the risks to long-only equity positions are growing.
Figure 1: Are we in the 6th, 7th, 8th or 9th Inning of the 9-Year Bull Market?
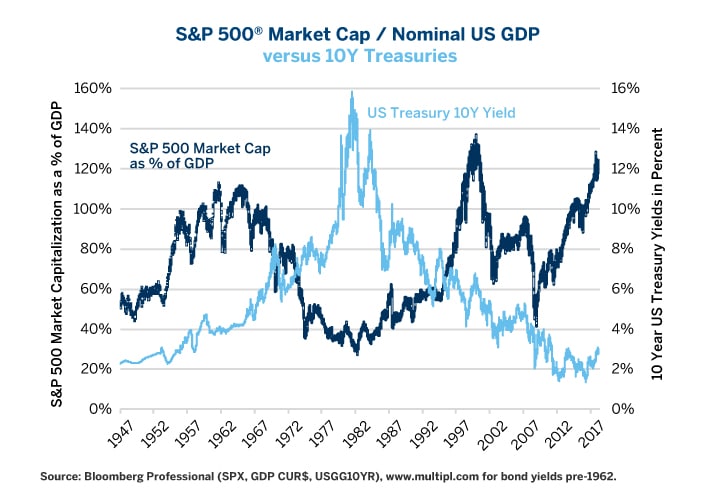
Adding to the risks facing equity investors are valuation levels. The S&P 500® trades at 21x trailing earnings while the Nasdaq is at 27.7x trailing earnings. Moreover, as a percentage of GDP, S&P 500®’s market cap has only been higher once before: in late 1999 into early 2000, on the eve of a 50% bear market that lasted until 2002 (Figure 2). Granted that when the market peaked in 2000, Fed Funds were at 6.5% and 30Y yields were around 7%. Today, Fed Funds are getting ready to push past 2%, assuming the Fed goes ahead with a September rate hike, and 30Y yields are close to 3%. One could argue that the S&P 500® can sustain much higher earnings and market cap/GDP ratios now than in the past owing to low interest rates and the general lack of attractive alternatives.
Figure 2: US Equity Aggregate Market Cap Has Rarely Been This High as a % of GDP.
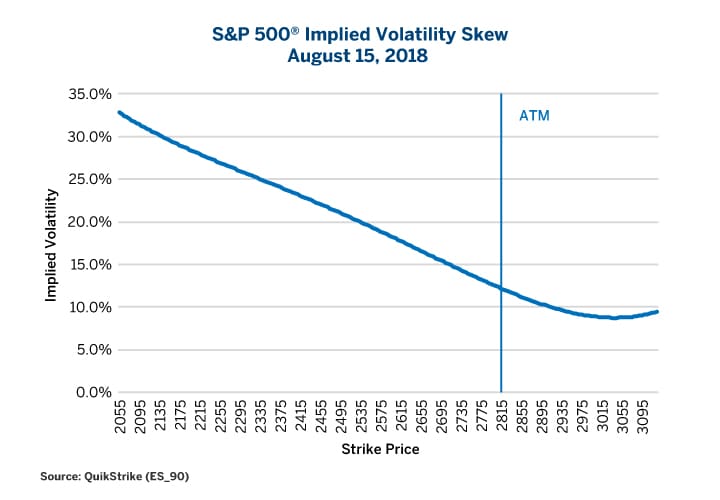
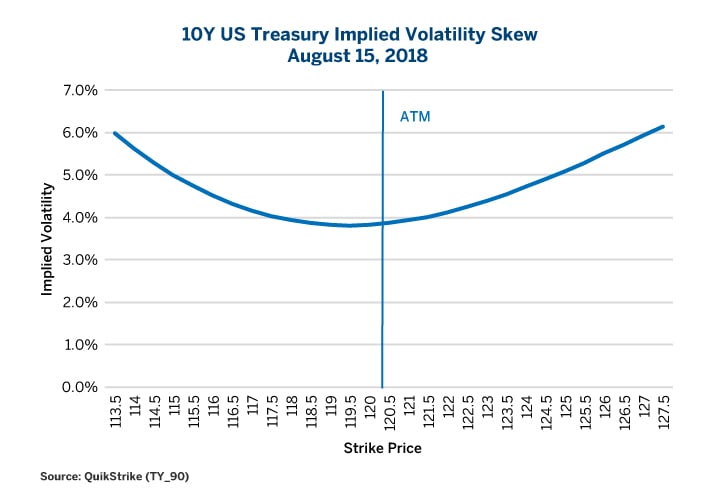
At first glance, it’s not apparent that equity options markets are worried about the current state of affairs. The VIX index and other measures of equity index volatility are trading near record lows, at least as far as at-the-money (ATM) options are concerned. When one moves away from ATM options, however, one sees a high degree of skewness (Figure 3). Put options are extremely expensive relative to calls. While this is usually the case for equity index options, it’s curious that the market for U.S. Treasury options doesn’t skew the opposite way (Figure 4). One might imagine that if the equity market suffers a sharp correction, U.S. Treasury bonds might stage an exceptionally strong rally as they often have in the past during times of equity market stress. Indeed since 1998, equity index futures and U.S. Treasuries have most often exhibited negative correlation on a rolling one-year basis (Figure 5). This has been especially true during periods of peak equity market stress, when owning put options on equity index futures – or call options on U.S. Treasuries-- would have been most helpful.
Figure 3: S&P 500® OTM Puts are Extremely Expensive Compared to OTM calls.
Figure 4: Treasury OTM Call Options are Only Slightly More Expensive Than OTM Treasury Puts.
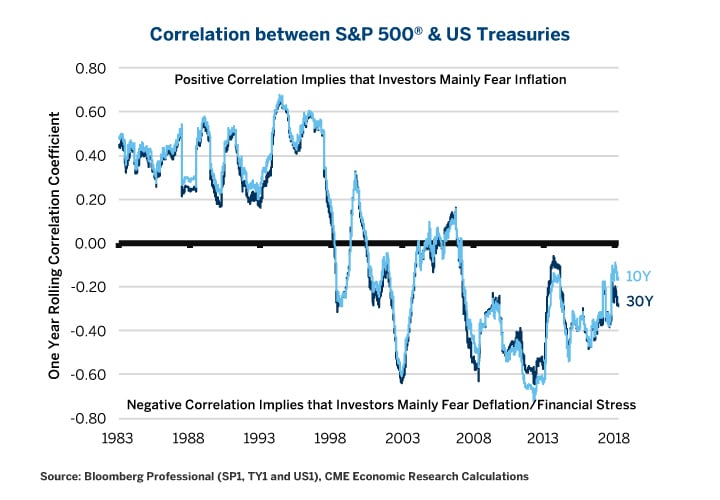
Figure 5: Since 1998 U.S. Treasuries and Equities Tend to Have Negative Correlation.
As such, it begs the question: given how asymmetrically expensive equity put options are compared to U.S. Treasury call options, what is the most cost-effective means of hedging equity market risk? The answer is complicated.
While U.S. Treasury options might pay off in the event of an equity market selloff, they are not guaranteed to do so. Although the correlation between Treasuries and equity index futures has generally been negative for the past two decades, it’s not perfectly negative. Moreover, the correlation could flip back to positive if investors come to fear inflation more than the risk of deflation and financial distress. Positive correlation was the typical state of the equity-treasury correlation pre-1998.
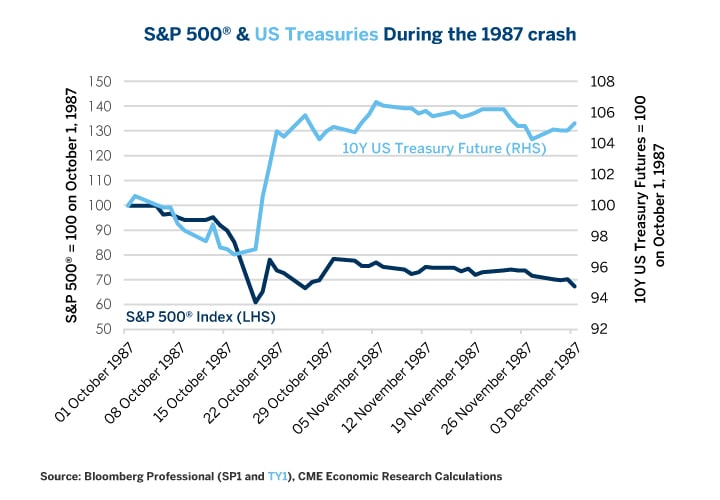
Moreover, during periods of market stress, Treasuries sometimes resist rallying as equity markets fall until the decline in equities becomes so extreme that it generates a flight-to-quality response. This was the case, for example, during the 1987 crash when equity markets fell out of bed between October 1 and October 19. The subsequent fixed income rally didn’t begin until October 20 (Figure 6).
Figure 6: Treasury Futures Exhibited a Delayed Response to the 1987 Stock Market Crash.
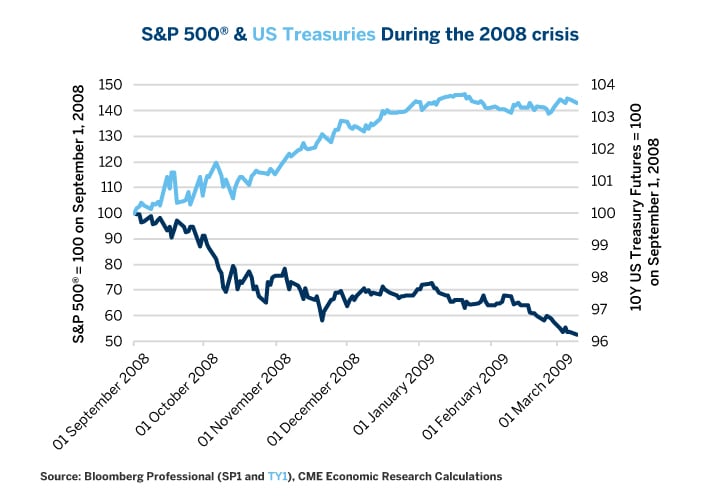
Likewise, during the 2008 panic, neither news that Lehman Brothers had failed nor during the first wave of the market crash did Treasury prices advance significantly. It wasn’t until later in October and November that bond prices really began to make significant gains (Figure 7).
Ultimately, the reason why equity index put options are so expensive is that equity markets are susceptible to abrupt declines. Treasuries don’t, however, always respond to these falls in real time with equally abrupt rallies. Moreover, in a world where inflation risks are probably symmetric, if not somewhat skewed to the upside, it’s easy to see why market participants see upside and downside risks to U.S. Treasuries as being relatively balanced. With budget deficits exploding and the Fed reducing its balance sheet, the supply of publicly available debt is likely to increase. As such, the market judges that downside risks to Treasuries to be nearly commensurate to their upside risks despite the equity markets downside worries.
Figure 7: U.S. Treasuries had their Biggest Advance After the Worst of the 2008 Equity Sell Off.
Bottom Line
- Equity index put options are extremely expensive compared to calls.
- Treasury puts and calls have a more symmetric implied volatility ‘smile.’
- As equites continue their rally, downside risks may be growing.
- While past equity market routs usually benefit Treasuries, there are no such guarantees.
- Risks of inflation and increased debt issuance may be keeping the Treasury option skew symmetrical.
Hedging Equities with Treasury Options
The nearly decade-long bull market in equities might be in its late stages, with the risk of being long-only in stocks growing amid rising interest rates and the possibility of a recession over the next two to three years. Protect your investment portfolio with options in U.S. Treasuries, which often exhibit a negative correlation with equity index futures.