- 22 Jul 2021
- By Erik Norland
- Topics: International Index
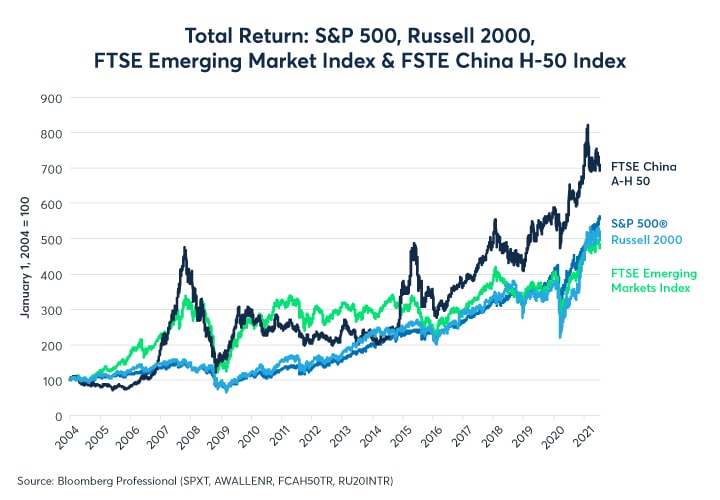
Equities have been a good place for investment over the past 17 years despite shocks like the global financial crisis and the pandemic. Since the beginning of 2004, the first full year for which we have data for the FTSE Emerging Market and China A-H 50 indexes, investors broadly made around 400% in emerging markets and around 600% if they invested only in Chinese shares. The 400% gain in the FTSE Emerging Markets total return index is very much in line with the total return for investors in the broadest and most diversified U.S. indexes like the S&P 500® and the Russell 2000 (Figure 1).
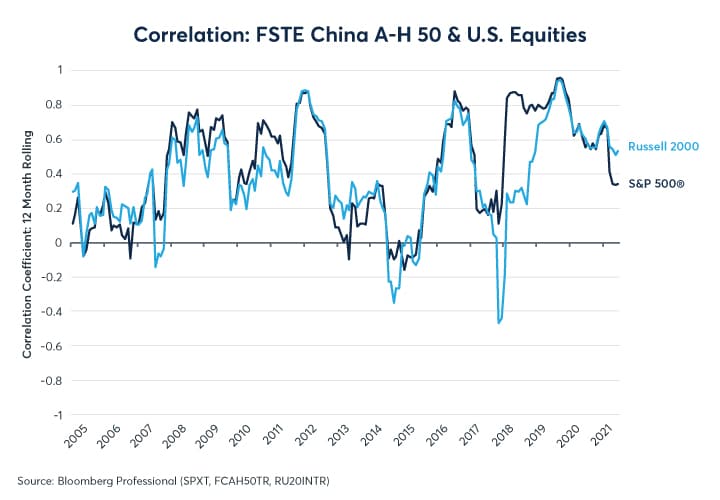
Perhaps what’s most interesting are the diversification possibilities between emerging market (including Chinese) shares and U.S. equities. While returns have been similar overall, correlations between the FTSE and U.S. indices has been far from perfect. The Russell 2000 and the S&P 500 have generally correlated more highly with the FSTE Emerging Market index (Figure 2) than with FTSE’s China A-H 50 (Figure 3). Correlations between U.S. and Chinese shares have not always been positive and have averaged around 0.3. With emerging market shares, correlations have generally been higher, except in the immediate aftermath of the 2016 U.S. Presidential election.
Differing sector weights explain to some extent the differing return patterns between Chinese and U.S. shares. While the FTSE Emerging Market index contains a significant allocation to technology shares, 25%, in line with the 27% in the S&P 500, the FTSE China index has only a 3% weighting to technology. The Chinese index has a much higher weighting to financial shares (37%) than the other indices, which range from 11-19% weighting to financial companies. Additionally, the China index also has a much higher weighting to consumer staples shares (28%) compared to around 3-6% in the other indices (Figure 4). Finally, the U.S. indices have much higher weighting to health care stocks than do the FTSE indices.
| Industry Sector | FTSE Emerging Markets | FSTE China A-H 50 | Russell 2000 | S&P 500® |
|---|---|---|---|---|
| Technology | 25.46% | 3.17% | 12.10% | 27.78% |
| Telecommunications | 3.75% | 1.76% | 1.95% | 11.17% |
| Health Care | 4.49% | 7.10% | 20.58% | 13.03% |
| Financials | 19.37% | 37.41% | 14.63% | 11.09% |
| Real Estate | 2.77% | 2.06% | 6.98% | 2.64% |
| Consumer Discretionary | 16.14% | 10.77% | 15.26% | 12.29% |
| Consumer Staples | 5.75% | 28.12% | 2.98% | 5.86% |
| Industrials | 6.17% | 3.39% | 14.53% | 8.45% |
| Basic Materials | 7.22% | 3.56% | 3.65% | 2.56% |
| Energy | 6.44% | 1.54% | 4.59% | 2.62% |
| Utilities | 2.44% | 1.10% | 2.73% | 2.50% |
Source: FTSE Russell, Bloomberg Professional (IMAP for SPX)
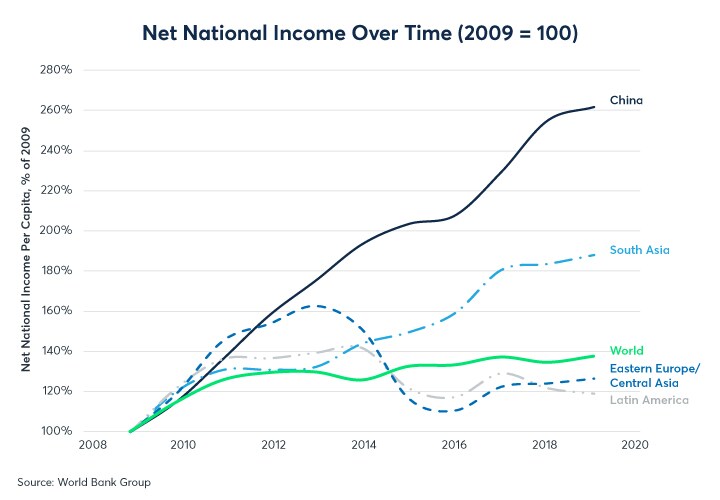
While the difference in sector weightings explains to some extent the strength of correlation between the various indices, they don’t explain the strong outperformance of Chinese shares. While U.S. markets, and especially the S&P 500 and the Nasdaq 100, have been driven higher by technology shares, this can’t be the case in China given their low weighting in the index. Rather, Chinese shares appear to have benefitted from the country’s exceptionally strong expansion over the past few decades which has far outpaced economic growth in other emerging markets. (Figure 5).
Since the pandemic began, Chinese growth has continued to outperform. During the past 18 months, consumers around the world have had less opportunity to spend money on experiences and, in addition to increasing their savings rates, they have also spent more money on manufactured goods. Since China is the workshop of the world and the premier manufacturing country, this set of circumstances has worked out to China’s advantage. As the world reopens, however, it is possible that consumers may shift their spending away from retail items and durable goods back towards experiences such as travel and entertainment. That said, given how much consumers have saved and the global easiness of monetary and fiscal policy, it is not entirely clear that consumers will necessarily have to choose: they may be able to opt to continue spending on manufactured goods while also boosting their spending on experiences.
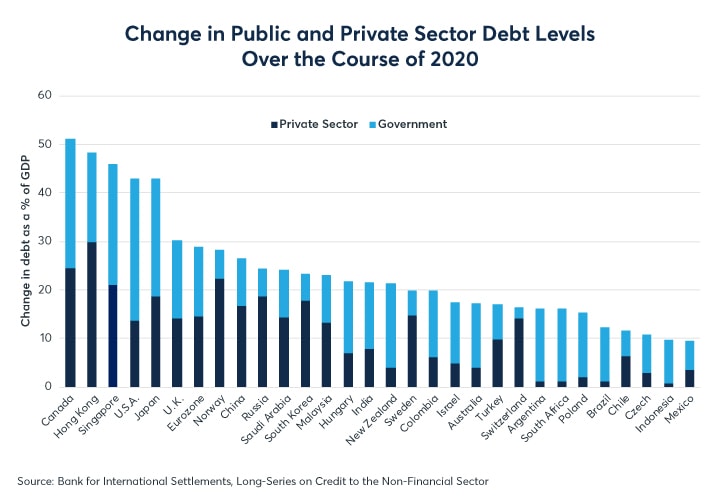
What is clear is economic policies has diverged enormously among nations over the course of the pandemic. China, Europe, Japan and especially the U.S. have seen their debt levels soar relative to the size of their respective GDPs (Figure 6). By contrast, most other emerging markets saw more modest increases in overall debt leverage. Part of the reason for this is that China and the developed markets began the pandemic with relatively low interest rates, which in turn placed the burden of supporting the economy on fiscal authorities.
As the pandemic hopefully begins to wind down, there are likely to be strong divergences between economic growth around the world and between different sectors of economy. This in turn could prove to be a major driver of returns for global equity markets and potentially a source of diverging outcomes.
All examples in this report are hypothetical interpretations of situations and are used for explanation purposes only. The views in this report reflect solely those of the author(s) and not necessarily those of CME Group or its affiliated institutions. This report and the information herein should not be considered investment advice or the results of actual market experience.
About the Author
Erik Norland is Executive Director and Senior Economist of CME Group. He is responsible for generating economic analysis on global financial markets by identifying emerging trends, evaluating economic factors and forecasting their impact on CME Group and the company’s business strategy, and upon those who trade in its various markets. He is also one of CME Group’s spokespeople on global economic, financial and geopolitical conditions.
View more reports from Erik Norland, Executive Director and Senior Economist of CME Group.
International Equity Index Products
Fine-tune your emerging market exposure with our growing portfolio of International Equity Index Products.


