- 8 Dec 2020
- By Jonathan Kronstein
Analyze Treasury market complexities using the new CME TreasuryWatch Tool, powered by QuikStrike. The tool aggregates information from eight unique data sets, including Treasury yields, US Treasury auctions and issuance, Federal Reserve balance sheet data, key market interest rates, and other resources to better analyze the factors impacting US Treasury markets. Never has so much information matching markets, monetary activity and the power of analytics been so powerful and easy to use.
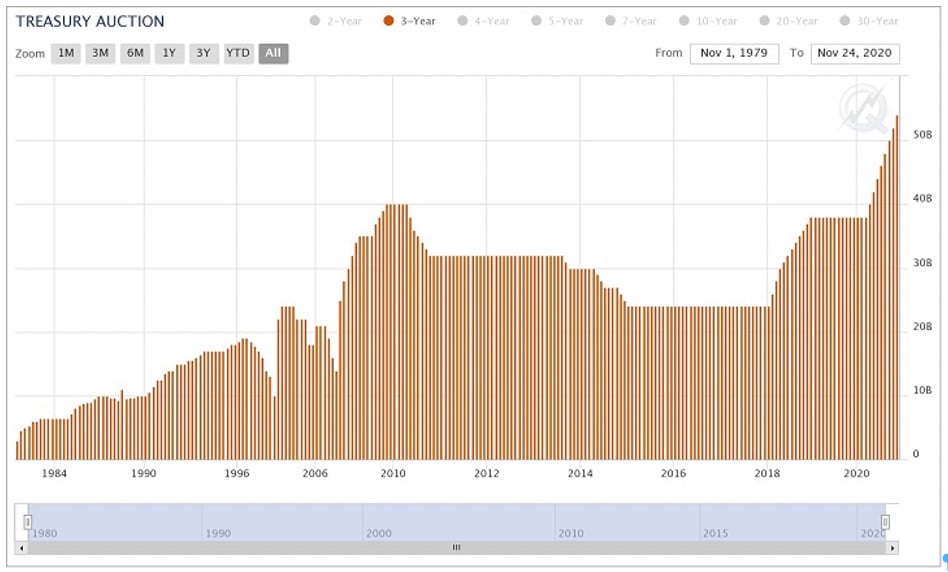
The new tool has many resources to help analyze Treasury auctions. In the Treasury Auctions & Issuance section in the center of the tool’s homepage, you will find the Treasury Auction chart (shown below) with recent issue sizes and auction results. For example, on Monday, November 9, the Treasury issued $54B of 3-year notes with a bid-to-cover ratio of 2.40. As you scroll over each monthly issue, the issue size and bid-to-cover ratio for each issue will be displayed. The 3-year note can be found on the orange line.
To explore auction data further, click and select “Show Detail Chart”. Here you can analyze historical auction data as far back as 1980. Figure 2 highlights the tool’s ability to filter the chart down to a specific tenor and highlights the historical magnitude of recent 3-year auction sizes.
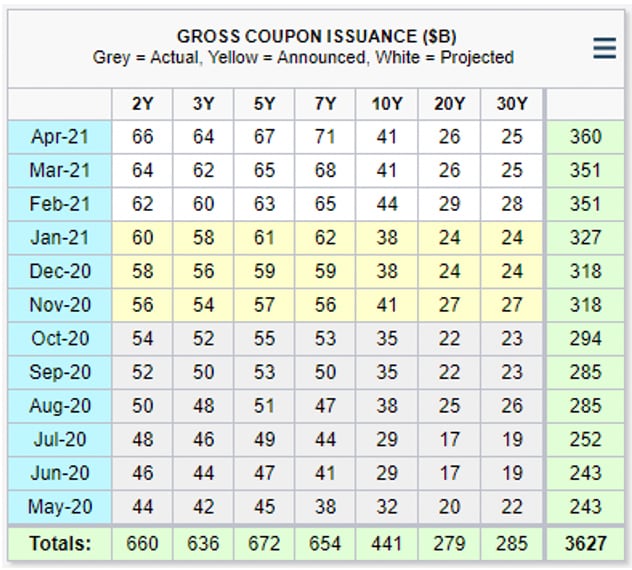
Please refer to the “Gross Coupon Issuance” table in the Treasury Auctions & Issuance section below the Treasury Auction chart. You will find a one-year history, past and future, for all Treasury notes and bond issue sizes in our TreasuryWatch Tool.
Treasury is increasingly committed to the 3-year tenor, with record-breaking issue sizes on a monthly basis. Treasury issue sizes that have been announced in the latest Treasury refunding announcement can be found in the yellow cells for Nov 20-Jan 21. Our projections can be found in the white cells for Feb-Apr 21. We are projecting Treasury will continue to increase 3-year issue sizes by $2.0B per month. Based on our 3-year projections, the issue size will be $62B in Apr 21. Meanwhile, with the growing 3-year issuance, the 3-Year Note futures deliverable grade is projected to be $512B for the Mar 21 contract, compared to $482B of cumulative issuance in the Dec 20 contract.
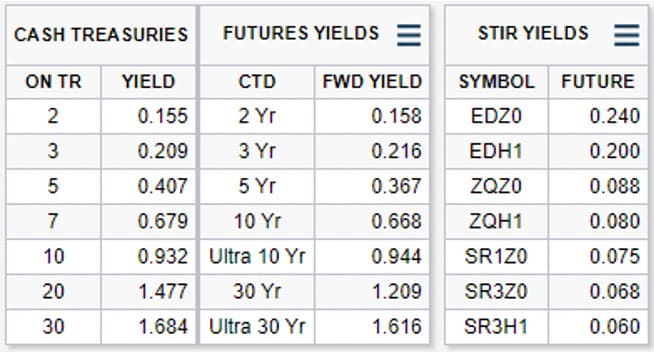
Please refer to the Current Market Environment section on the left side of the tool’s homepage, where you will find Interest Rate yields for three types of instruments: Cash Treasuries, Treasury futures, and STIR futures.
The tool also offers a current chart of Treasury futures implied yields by the cheapest-to-deliver (CTD) until the last delivery day. To create the chart of implied yields, select “Show Yield Curve Chart” in the Futures Yields section of the tool. As demonstrated in Exhibit 5 below, the interactive chart of implied yields, which allows for comparing yield changes over time, displays implied yields as your scroll over each tenor. As of Dec. 3, 2020, the 3-Year futures had an implied yield of 0.2175%, down from the Dec. 2 settle of 0.2347%. The Treasury yield curve chart highlights that the 3-year tenor is clearly a distinct point on the Treasury curve, both for purposes of position management and yield curve spreads, the latter of which is a significant driver of 3-Year trading volumes. Read our previous article here to learn more about yield curve spread opportunities created by the addition of 3-Year futures.
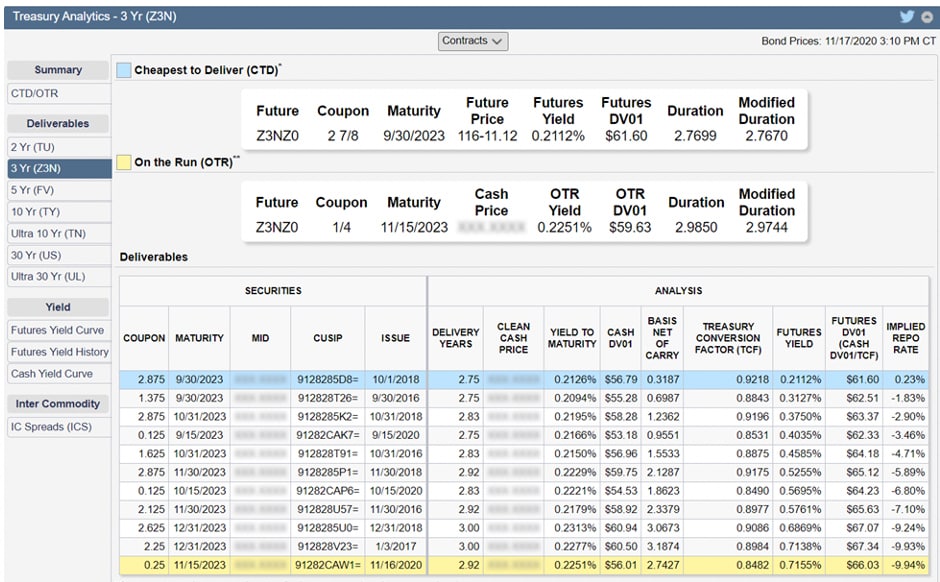
For a more in-depth analysis of Treasury futures, CTD, risk metrics, yields, and deliverable notes and bonds, check out CME Group’s Treasury Analytics tool, powered by QuikStrike. The table below depicts notes eligible for delivery into the Dec 2020 3-Year Note futures, ranked by CTD, as of Nov. 17, 2020.
About CME Group
As the world’s leading derivatives marketplace, CME Group is where the world comes to manage risk. Comprised of four exchanges - CME, CBOT, NYMEX and COMEX - we offer the widest range of global benchmark products across all major asset classes, helping businesses everywhere mitigate the myriad of risks they face in today's uncertain global economy.
Follow us for global economic and financial news.


