- 4 Dec 2020
- By CME Group
As the five-year anniversary of the Ultra 10-Year Note futures launch approaches, trading activity and market participation continues to grow, spurring a look back at theoretical historical pricing
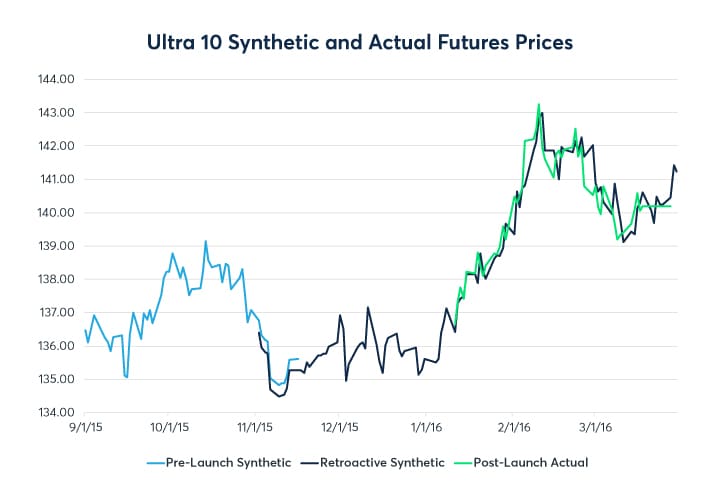
By using Cheapest to Deliver cash note settlements and repo financing rates, new historically derived prices were calculated for late 2015 and early 2016, extending the initial synthetic prices and allowing a comparison to actual post-launch settlements
A similar methodology to the original price history was used:
- 10-Year U.S. Treasury Notes which would have been Cheapest to Deliver for TN futures contracts were identified, along with their Conversion Factors.
- Cash price histories for these CUSIPs were gathered for the relevant time periods (November-December for the Dec2015 contract, January-March for the Mar2016 contract).
- Repo terms for each of the remaining day counts to expiry were extrapolated.
- Cash settlements less coupon income and accrued interest were used to determine carry-free cash prices.
- These cash prices were converted to futures-equivalents using the conversion factors.

The retroactively derived prices match up well with the end of the series created in late 2015 ahead of the Ultra 10-Year Futures launch. Newly created synthetic futures prices from November 2015 to January 2016 show an uptick in volatility, but this matches the behavior of the cash Treasury Notes during that time.
The series further aligns with the start of the actual futures price history beginning at the product launch in mid-January 2016, through the first contract’s expiry at the end of March 2016. With the original series extrapolated back through September 2004, this means more than 16 years of gapless settlement price data available for analysis and back testing, allowing market participants to better gauge how the TN Futures fit into their fixed income portfolio.
About CME Group
As the world’s leading derivatives marketplace, CME Group is where the world comes to manage risk. Comprised of four exchanges - CME, CBOT, NYMEX and COMEX - we offer the widest range of global benchmark products across all major asset classes, helping businesses everywhere mitigate the myriad of risks they face in today's uncertain global economy.
Follow us for global economic and financial news.