Russell US Equity Indices Reconstitution Results
The Russell US Indices were reconstituted at close of trading on Friday, June 28, concluding an annual seven-week process during which FTSE International Ltd, the index administrator, made rule-based changes to their composition to ensure they remain accurately reflective of market conditions. The newly rebalanced Russell US Indices took effect on Monday, July 1, 2019, and will remain in place for 12 months.
Among them, the Russell 1000®, 2000®, and 3000® contain some or all of a total 3,000 stocks, representing a combined 98 percent of the investable US equity market. The large-cap Russell 1000® accounts for 92.4% of Russell 3000® aggregate market cap; the small-cap Russell 2000® accounts for 7.6%1.
Key features of this year’s Reconstitution reveal much about the dynamism of the US equity market:
- The Reconstitution event itself culminated in one of the highest trading volume days in US equity shares in the last year. The Nasdaq Closing Cross, for instance, witnessed a record 1.279 billion shares, worth $42.59 billion, executed within 1.14 seconds 2 .
- Russell 3000® market capitalization hit an all-time high of $31.7 trillion on Reconstitution day, up 3% from a year earlier.
- Large caps led the charge. The Russell 1000® gained 6.1% from last year’s rebalance through May 10, during which time the Russell 2000® posted a 5.5% decline. At Reconstitution, Russell 1000® market cap was $29.3 trillion versus $28.2 trillion a year earlier.
- The technology sector emerged as the main driver of these gains, rallying nearly 40% since last year, abetted by big contributions from the consumer staples and healthcare sectors.
- The largest five companies in the Russell 3000® universe stood unchanged from 2018’s Reconstitution, but their rank order is rearranged. After a 2.1% fall in market cap from a year ago, Apple slipped to third place from the top spot, which it had held since 2012. Microsoft and Amazon, which grew nearly 30% and 20%, respectively, are now the first and second largest index constituents. Rounding out the tech-heavy Top 5 are Alphabet and Facebook. See Exhibit 1.
- Visa, at ninth place with $351.2 billion market cap, is the only new Top 10 entrant in this year’s Reconstitution, superseding Bank of America.
- Prominent in the 2019 Reconstitution is the inclusion of many of the "hot" initial public offerings from 2017, 2018 and 2019. Uber, Lyft, Spotify (via a direct listing), Beyond Meat, and PagerDuty are new entrants to the Russell 1000®, while 27 other recent IPOs, mostly in the healthcare and financial services sectors, have joined the Russell 2000®.
- Despite the arrival of these new recruits, Russell 2000® aggregate market cap decreased 4%, to $2.4 trillion versus $2.5 trillion at last year’s Reconstitution.
Exhibit 1 – Largest companies in the Russell 3000® Index / Russell 1000® Index by total market cap
Source: FTSE Russell. As at May 10, 2019.
Additions and Deletions
Russell 3000®
- The latest Reconstitution adds nearly 200 new companies. Of those, 115 graduated from the Russell Microcap® Index, while 80 or so are new entrants, including recent initial public offerings.
Russell 1000®
- 47 new companies are entering the Russell 1000®, 36 of which are migrating from the Russell 2000®.
- Eleven of those 36 are in the consumer discretionary sector. 13 are technology companies. The remaining 12 hail from financial services, health care, producer durables, and utilities sectors.
- Four IPOs are added -- Beyond Meat, LYFT, PagerDuty, and Uber.
- So too is Spotify, which joins via its 2018 direct listing, along with six other companies which join as new additions to the Russell US Index universe, including Dropbox and Janus Henderson Group.
- Of the 21 companies departing the Russell 1000®, 19 are migrating to the Russell 2000®, and two have left the Russell 3000® universe.
Russell 2000®
- The 2019 Reconstitution brings 189 new companies into the Russell 2000®. Beyond the 19 moving in from the Russell 1000®, another 74 are shifting up from the Russell Microcap® Index. Of those 74, 30 represent the health care sector, 13 are technology companies, and 9 are financial services firms.
- Joiners also include 27 IPOs, mostly from the health care and financial services sectors. Another 69 companies have been recruited from outside the Russell US Index universe.
- 157 companies are leaving. Apart from the 36, mentioned above, that have graduated to the Russell 1000®, 97 others have moved to the Russell Microcap®, and the remaining 24 have fallen out of the Russell 3000® universe.
Breakpoints
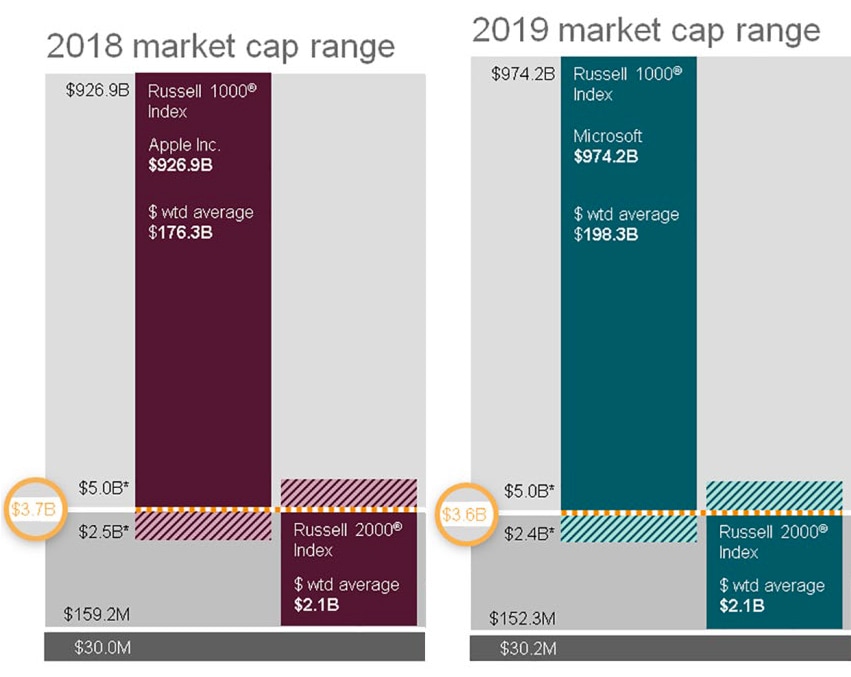
Year-to-year changes in the breakpoint between the Russell 1000® and the Russell 2000®, i.e., the market capitalization that demarcates the boundary between large-cap and small-cap sectors, make a useful gauge of secular growth in market valuations. Reflecting a challenging 12 months for US small-cap shares, the latest Reconstitution saw the breakpoint decrease to $3.6 billion from $3.7 billion in 2018. See Exhibit 2.
The lower bound of the Russell 2000® is likewise indicative. At this year’s Reconstitution, the threshold market capitalization for a new index member was around $152.3 million; in 2018 it was $159.2 million, 4.5% higher.
Exhibit 2 – Breakpoints between Russell 1000® and Russell 2000®, with and without banding
https://www.cmegroup.com/content/dam/cmegroup/education/images/articles/2019/russel-exhibit2.jpg
Source: FTSE Russell. Reflects data as of May 11, 2018 and May 10, 2019, respectively.
Why Reconstitution matters
Approximately $9 trillion of equity market exposure is benchmarked to the Russell US Indices, with countless ETFs and mutual funds mirroring the composition of the Index suite. At annual Reconstitution, Index funds that track the Indices must sell all stocks that are deleted and buy all stocks that are added. Within any Index, moreover, incumbent stocks that remain after Reconstitution typically exhibit changes in their Index weights. All of this creates risk through slippage and possible tracking error. But it also creates opportunities, if only because changes in aggregate Russell 2000® market cap are intertwined with relative gains and losses among the Index’s constituent GIC sectors.
Since 2017, when the E-mini Russell 2000® Index futures returned to CME, the sectoral composition of the Russell 2000® has moved dramatically from one annual Reconstitution to the next. See Exhibits 3 and 4. This year, for instance, the consumer staples and technology sectors enjoyed significant additions.
Exhibit 3 -- Russell 2000® Index Composition by GICS Sector (2017 – 2019)
Source: Bloomberg
Exhibit 4 – Members of the Russell 2000® Index by GICS Sector Market Cap (2017 – 2019)
Source: Bloomberg
CME E-mini Russell 2000® Index Futures
E-mini® Russell 2000® Index (RTY) futures are a cost-efficient tool for shifting risk, and a convenient alternative to cash market instruments. Among RTY’s market characteristics are deep liquidity and substantial open interest -- two key features for anyone concurrently trading futures and cash index exposures. See Exhibit 5. Provisions for exchange-for-physical (EFP) transactions, block trading, and Basis Trade at Index Close (BTIC) transacting ensure that multiple avenues are open to contract users for position entry and exit.3
In addition to allowing market participants to hedge macro exposures or anticipated directional movements in the Russell 2000® Index, RTY futures can provide a cost-efficient vehicle to assist with market capitalization spread strategies. For example, a portfolio manager expecting small-cap stocks to outperform large-cap stocks could enter an intermarket spread strategy combining purchase of RTY futures and sale of an equivalently-sized number of CME E-mini S&P 500 Index (ES) futures contracts. At this writing, the CME Clearing margin spread credit is 80% for a position scaled to 2 RTY long (short) versus 1 ES short (long).4
RTY futures likewise can furnish users with a means to utilise intra-market price discrepancies. A trader can enter a calendar spread, for example, by buying September RTY contracts and selling an equivalent exposure in December RTY contracts, if an opportune price discrepancy emerges between the two delivery months.5
The Exchange’s listings include companion options on RTY futures, enabling a wide array of option spread strategies and Russell 2000® Index volatility plays. CME also offers futures products based on the Russell 2000® Growth Index and the Russell 2000® Value Index, potentially useful for many purposes, including cash equitization solutions and tactical asset allocation.
Exhibit 5: CME E-mini Russell 2000® Index Futures – Average Daily Trading Volume and Month-End Open Interest
https://www.cmegroup.com/content/dam/cmegroup/education/images/articles/2019/russel-exhibit1.jpg
Source: CME group
Resources
- All references to the composition of the indices, their performance, market capitalization and ranking of specific companies within the index, are taken from FTSE Russell
- Nasdaq press release June 28, 2019
- For information on exchange-for-related-position transacting, including EFRPs, visit: https://www.cmegroup.com/clearing/operations-and-deliveries/accepted-trade-types/efp-efr-eoo-trades.htmlp See also CME Group, Block Trades, Market Regulation Advisory Notice RA1906-5, available at: https://www.cmegroup.com/rulebook/files/cme-group-Rule-538.pdf
For information on block trading, see: https://www.cmegroup.com/clearing/trading-practices/block-trades.html See also CME Group, Exchange for Related Positions, Market Regulation Advisory Notice RA1901-5, available at: https://www.cmegroup.com/rulebook/files/cme-group-Rule-526.pdf
For information concerning BTIC transacting, see: https://www.cmegroup.com/trading/equity-index/btic-transactions.html - Performance bonds, also known as margins, are deposits held at CME Clearing to ensure that clearing members can meet their obligations to their customers and to CME Clearing. Performance bond requirements vary by product and by market volatility levels and are subject to review and revision by CME Clearing. For up-to-date information regarding margin credits on intermarket spread positions, visit: https://www.cmegroup.com/clearing/margins/inters.html#pageNumber=1
- As with intermarket spread positions, potentially significant margin offsets may apply to intra-market calendar spread positions. For current information on margin credits that CME Clearing applies to intra-market calendar spread positions, visit: https://www.cmegroup.com/clearing/margins/intras.html#pageNumber=1&sortField=exchange&sortAsc=true&exchange=CME§or=EQUITY+INDEX&clearingCode=RTY
Disclaimer
This information was obtained from sources believed to be reliable, but we do not guarantee its accuracy. Neither the information nor any opinion expressed therein constitutes a solicitation of the purchase or sale of any futures or options contracts.
E-mini Russell 2000
Learn more about futures and options on the Russell 2000 Index, and how to use these contracts to manage risk and tap into liquidity.