Bond Trading: Setting Recent Volatility in Context
Executive summary
The US Treasury bond complex experienced extremely high levels of volatility in March 2020 as the consequences of the COVID-19 virus impacted on the US and global economies. In terms of outright bond prices, observed intraday volatility was the highest in recent years, although intraday moves were not generally as large as those seen during the financial crisis when measured in yield terms. The cost to trade rose in March but by a lower rate than might have been expected, given the significantly higher intraday volatility. It was also noteworthy how quickly the bond market moved back into its normal trading range, despite ongoing uncertainty around the economic impact of COVID-19.
Wide Range Days
Normally, 30-year U.S. Treasury bonds on CME Group’s BrokerTec platform trade in an intraday range of one to two points.
An intraday trading range that exceeds four points, double the normal range, is known as a ‘wide range day.’ These days are exceedingly rare, with just 30 such days since the start of the financial crisis of 2008.
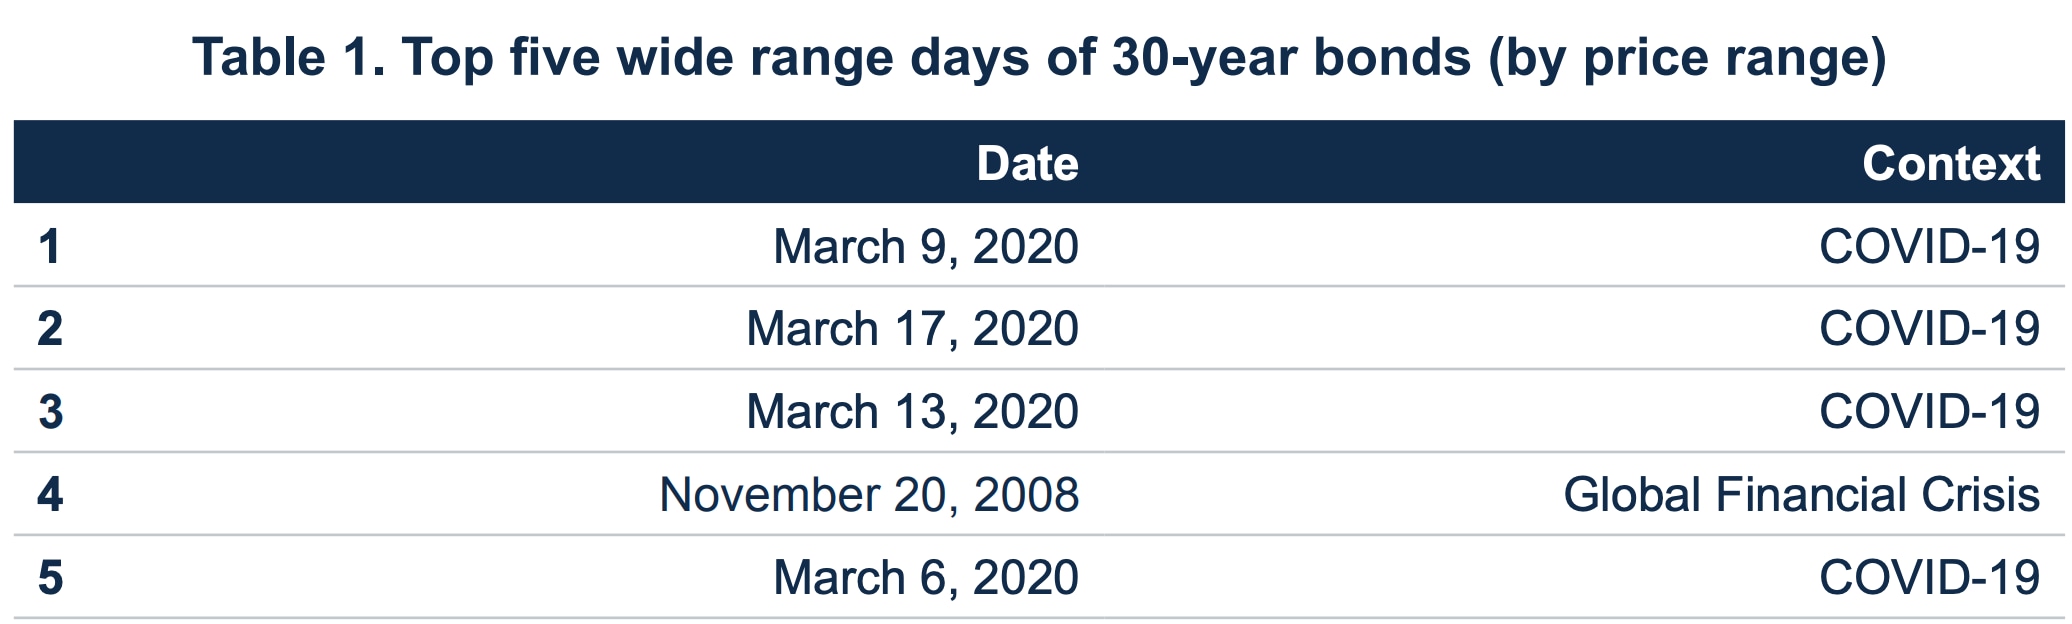
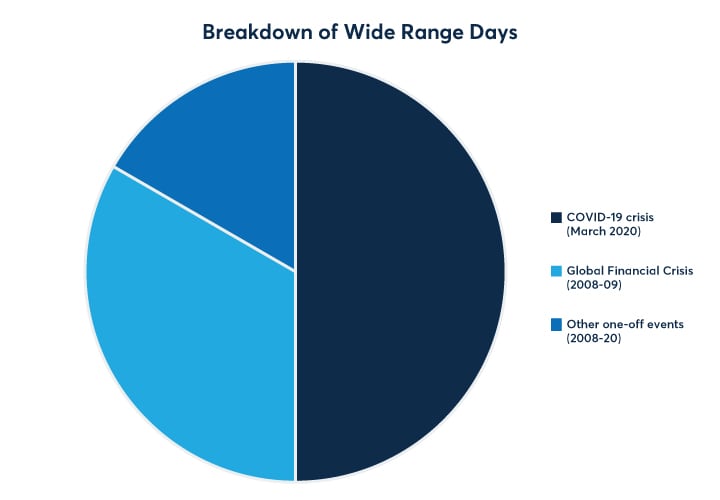
Half of the 30 wide range days seen since 2008 were observed in March 2020, indicating the unprecedented severity of the economic disruption created by COVID-19 and its attendant impact on volatility. March 2020 also included the widest price range ever observed on BrokerTec for 30-year bonds, with the intraday action reaching over 11 points on March 9, 2020
It is worth bearing in mind that March 2020 was the first time that the bond market had experienced such extraordinary volatility at a time when virtually all participants were working from home and in many cases facing difficulties in terms of their day-to-day operations. This unique challenge was clearly a factor that added to the extended volatility experienced that month.
Previous wide range days
Prior to March 2020, the most sustained period of volatility was recorded at the start of the Global Financial Crisis when the economic crisis led to sharply increased volatility levels, including 10 wide range days between September 2008 and March 2009.
The first wide range day for 30-year bonds was on September 15, 2008, the day that the investment bank Lehman Brothers filed for bankruptcy, which is generally considered to mark the beginning of the financial crisis.
Other wide range days followed as the economic situation worsened, with the most volatile day coming in November 20, 2008 – the day that equities also plunged to a five-and-a-half year low. November 20, 2008 saw 30-year bond prices trade at lows of 109-26 and highs of 119-20, an intraday range of 9 and 26/32nds that would stand as a record until the COVID-19 crisis of March 2020.
Beyond the 10 wide range days of the early financial crisis, wide range days were a relatively rare occurrence until the COVID-19 outbreak of 2020.
Just five wide days were observed in this period and all were driven by single one-off events: the ‘flash crash’ of May 6, 2010; the loss of the United States’ AAA rating on August 9, 2011; the US Treasury ‘flash rally’ of October 15, 2014; the Brexit referendum reaction on June 24, 2016; and the US presidential election of Donald Trump on November 9, 2016. In all five cases, the market immediately reverted to its normal trading range the following day.
After reviewing the history of wide range days, there does not appear to be any correlation between the direction of price activity in the market and the incidence of wide range days: of the 30 wide range days seen on BrokerTec since 2008, 17 saw prices trade upwards, while 13 saw prices trade downwards.
Price versus yield
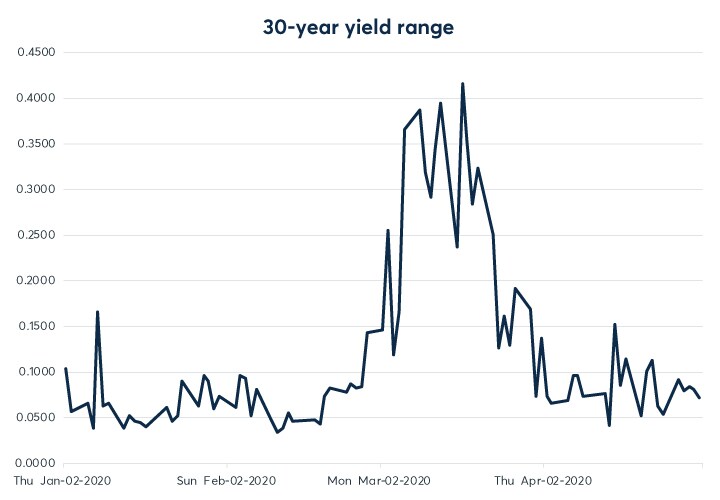
As we have seen, March 2020 saw the widest intraday price ranges ever seen for 30-year bonds. But in yield terms, the movements were less pronounced than some of those seen in previous years.
The largest intraday move in yield terms during the COVID-19 crisis was the 41.5 basis points seen on March 17, 2020. But there were two other moves previously that were larger in terms of yield. Both took place during the financial crisis of 2008-09: the 49.9 basis points seen on November 20, 2008 and the 50.1 basis points of March 18, 2009, which was the day that the Federal Reserve announced an additional $1 trillion of quantitative easing and which remains a record for intraday volatility in yield terms.
The higher volatility in yield terms during the financial crisis reflects the impact of reduced yields in recent years, which have served to dampen the volatility of yields relative to price.
Table 2. Top five wide range days of 30-year bonds (by yield range)
| Date | Context | |
| 1 | March 18, 2009 | Global Financial Crisis |
| 2 | November 20, 2008 | Global Financial Crisis |
| 3 | March 17, 2020 | COVID-19 |
| 4 | March 13, 2020 | COVID-19 |
| 5 | March 9, 2020 | COVID-19 |
Although the absolute price moves seen in March 2020 were the highest seen in history, the dollar value per unit change in the yield (DV01) was also extremely high and therefore the yield change, while very substantial both in itself and also as a percentage of the yield where the bond was trading, was not as high as some of the shifts seen in 2008-09.
Comparing March 2020 with March 2009, the DV01 in 2020 was some 70% higher than 11 years previously. This means that, although the bid-offer spread widened in March 2020, it was still significantly lower than the yield spread of 2009, as it would have needed to widen by 70% in order for the bid-offer spread to remain equal in terms of basis points.
When analyzing the widening of bid-offer spreads in March 2020, it is clearly important to consider elements such as the yield value of a 32nd, which was lower than it was in previous episodes such as the financial crisis. The performance of bid-offer spreads should be considered not only in outright terms but also in terms of the value of a 32nd and of the DV01.
Cost to trade & daily true range
In times of sharply heightened economic uncertainty, market volatility is likely to increase because with so many potential outcomes, firms may be hesitant to provide liquidity due to the increased likelihood that their assessment of conditions will be wrong. Bid-offer spreads will therefore widen, and liquidity decreases.
Market makers also make returns on capital at risk by attempting to capture a portion of the bid-offer spread. They therefore increase their bid-offer spreads (the fee they earn) when their cost (volatility, i.e., the difficulty in capturing the bid-offer) increases.
These factors illustrate why increased volatility should, all other things being equal, cause wider bid-offer spreads and lower depth of book.
Prior to the COVID-19 crisis, economic forecasts expected the US to experience growth in gross domestic product in the low single digits. The unprecedented economic uncertainty introduced in March 2020 drove volatility (daily price ranges) higher and led to record numbers of wide range days.
In order to assess the performance of liquidity during a wide range day, we need to evaluate the cost to trade as a function of the volatility observed.
During the 15 wide range days of March 2020, liquidity on BrokerTec was reduced and bid-offer spreads were wider. But the impact on the market was significantly lower than might have been expected, given the severity of the increase in market volatility. In fact, the bid-offer spread and the cost to trade actually decreased as a percentage of the daily true range.
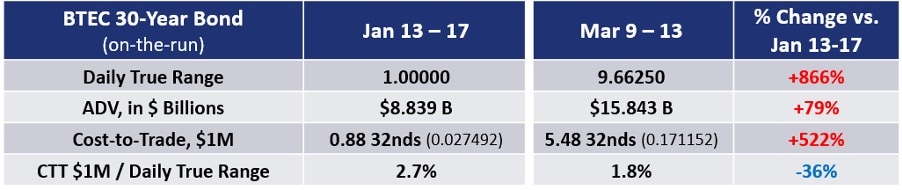
The table below shows that while the daily true range for the week of the most extreme volatility (March 9–13, 2020) increased by an amazing 866% for the 30-year bond, cost to trade of $1 million of notional value increased by less than two-thirds of that percentage, compared with a baseline period of January 13-17, 2020, leading to a relative decline in the cost to trade, given the underlying volatility.
The cost to trade versus daily true range analysis can be used as a proxy for liquidity versus volatility. While the cost to trade (liquidity) did increase for the 30-year bond on BrokerTec, the increase was less than the substantial increase in daily true range (volatility), indicating that liquidity held up remarkably well and reduced the expected cost to trade.
Conclusion
Liquidity is crucial to ensure the proper functioning of markets, especially during periods of extreme volatility. While traditional measures of liquidity can be useful indications of market conditions, they are ill-equipped to tell the whole story experienced by market participants during the volatility of late winter 2020. Using these holistic liquidity metrics, which show the cost-to-trade relative to the daily true range and volume, users can more accurately measure the environment traders faced and the resilience of CME Group’s markets.